Brazilian vs Paiute Unemployment Among Ages 60 to 64 years
COMPARE
Brazilian
Paiute
Unemployment Among Ages 60 to 64 years
Unemployment Among Ages 60 to 64 years Comparison
Brazilians
Paiute
5.0%
UNEMPLOYMENT AMONG AGES 60 TO 64 YEARS
10.1/ 100
METRIC RATING
222nd/ 347
METRIC RANK
5.8%
UNEMPLOYMENT AMONG AGES 60 TO 64 YEARS
0.0/ 100
METRIC RATING
325th/ 347
METRIC RANK
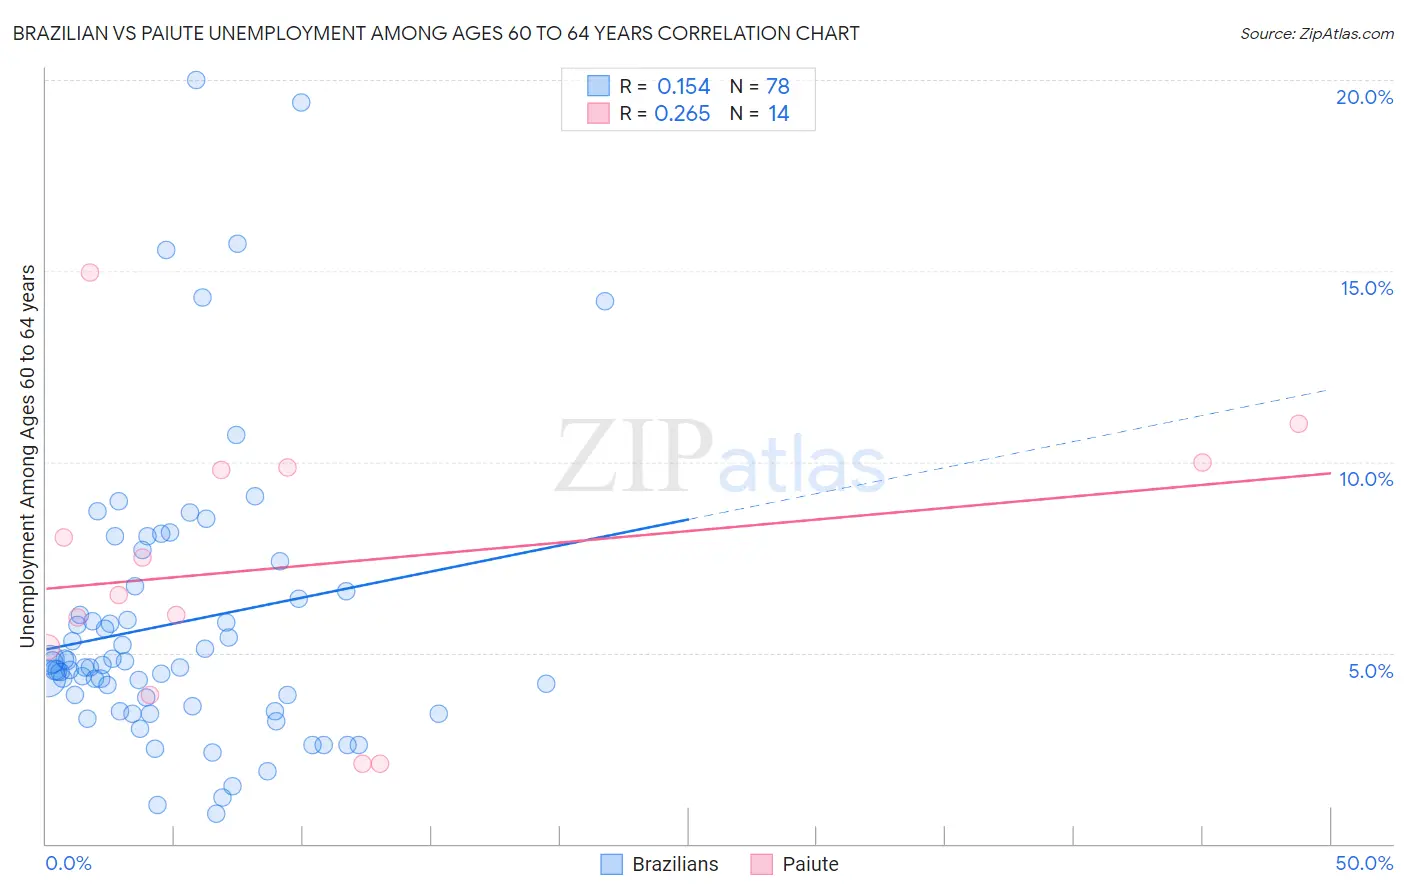
Brazilian vs Paiute Unemployment Among Ages 60 to 64 years Correlation Chart
The statistical analysis conducted on geographies consisting of 300,585,145 people shows a poor positive correlation between the proportion of Brazilians and unemployment rate among population between the ages 60 and 64 in the United States with a correlation coefficient (R) of 0.154 and weighted average of 5.0%. Similarly, the statistical analysis conducted on geographies consisting of 56,738,721 people shows a weak positive correlation between the proportion of Paiute and unemployment rate among population between the ages 60 and 64 in the United States with a correlation coefficient (R) of 0.265 and weighted average of 5.8%, a difference of 17.4%.
Unemployment Among Ages 60 to 64 years Correlation Summary
| Measurement | Brazilian | Paiute |
| Minimum | 0.80% | 2.1% |
| Maximum | 20.0% | 15.0% |
| Range | 19.2% | 12.9% |
| Mean | 5.8% | 7.3% |
| Median | 4.6% | 7.0% |
| Interquartile 25% (IQ1) | 3.6% | 5.1% |
| Interquartile 75% (IQ3) | 6.6% | 9.9% |
| Interquartile Range (IQR) | 3.0% | 4.7% |
| Standard Deviation (Sample) | 3.8% | 3.6% |
| Standard Deviation (Population) | 3.7% | 3.5% |
Similar Demographics by Unemployment Among Ages 60 to 64 years
Demographics Similar to Brazilians by Unemployment Among Ages 60 to 64 years
In terms of unemployment among ages 60 to 64 years, the demographic groups most similar to Brazilians are Ugandan (4.9%, a difference of 0.040%), Crow (5.0%, a difference of 0.040%), Immigrants from Brazil (4.9%, a difference of 0.14%), Ottawa (4.9%, a difference of 0.14%), and Immigrants from Cameroon (5.0%, a difference of 0.16%).
| Demographics | Rating | Rank | Unemployment Among Ages 60 to 64 years |
| Immigrants | South Eastern Asia | 13.1 /100 | #215 | Poor 4.9% |
| Cajuns | 12.3 /100 | #216 | Poor 4.9% |
| Koreans | 12.2 /100 | #217 | Poor 4.9% |
| Immigrants | Singapore | 12.0 /100 | #218 | Poor 4.9% |
| Immigrants | Brazil | 11.7 /100 | #219 | Poor 4.9% |
| Ottawa | 11.6 /100 | #220 | Poor 4.9% |
| Ugandans | 10.5 /100 | #221 | Poor 4.9% |
| Brazilians | 10.1 /100 | #222 | Poor 5.0% |
| Crow | 9.7 /100 | #223 | Tragic 5.0% |
| Immigrants | Cameroon | 8.5 /100 | #224 | Tragic 5.0% |
| Immigrants | Ireland | 7.2 /100 | #225 | Tragic 5.0% |
| Immigrants | Chile | 6.8 /100 | #226 | Tragic 5.0% |
| Nigerians | 6.8 /100 | #227 | Tragic 5.0% |
| Immigrants | Belarus | 6.4 /100 | #228 | Tragic 5.0% |
| Africans | 5.9 /100 | #229 | Tragic 5.0% |
Demographics Similar to Paiute by Unemployment Among Ages 60 to 64 years
In terms of unemployment among ages 60 to 64 years, the demographic groups most similar to Paiute are Immigrants from Ecuador (5.8%, a difference of 0.010%), Alsatian (5.8%, a difference of 0.35%), Immigrants from St. Vincent and the Grenadines (5.9%, a difference of 0.94%), Ecuadorian (5.8%, a difference of 0.96%), and Immigrants from Grenada (5.9%, a difference of 1.0%).
| Demographics | Rating | Rank | Unemployment Among Ages 60 to 64 years |
| Natives/Alaskans | 0.0 /100 | #318 | Tragic 5.7% |
| Immigrants | Belize | 0.0 /100 | #319 | Tragic 5.7% |
| Colville | 0.0 /100 | #320 | Tragic 5.7% |
| Dutch West Indians | 0.0 /100 | #321 | Tragic 5.7% |
| Ecuadorians | 0.0 /100 | #322 | Tragic 5.8% |
| Alsatians | 0.0 /100 | #323 | Tragic 5.8% |
| Immigrants | Ecuador | 0.0 /100 | #324 | Tragic 5.8% |
| Paiute | 0.0 /100 | #325 | Tragic 5.8% |
| Immigrants | St. Vincent and the Grenadines | 0.0 /100 | #326 | Tragic 5.9% |
| Immigrants | Grenada | 0.0 /100 | #327 | Tragic 5.9% |
| Apache | 0.0 /100 | #328 | Tragic 6.0% |
| Immigrants | Bangladesh | 0.0 /100 | #329 | Tragic 6.0% |
| Immigrants | Armenia | 0.0 /100 | #330 | Tragic 6.0% |
| Yakama | 0.0 /100 | #331 | Tragic 6.0% |
| Dominicans | 0.0 /100 | #332 | Tragic 6.0% |