Potawatomi vs Immigrants from Hong Kong Unemployment Among Ages 20 to 24 years
COMPARE
Potawatomi
Immigrants from Hong Kong
Unemployment Among Ages 20 to 24 years
Unemployment Among Ages 20 to 24 years Comparison
Potawatomi
Immigrants from Hong Kong
10.3%
UNEMPLOYMENT AMONG AGES 20 TO 24 YEARS
42.0/ 100
METRIC RATING
176th/ 347
METRIC RANK
10.5%
UNEMPLOYMENT AMONG AGES 20 TO 24 YEARS
17.6/ 100
METRIC RATING
208th/ 347
METRIC RANK
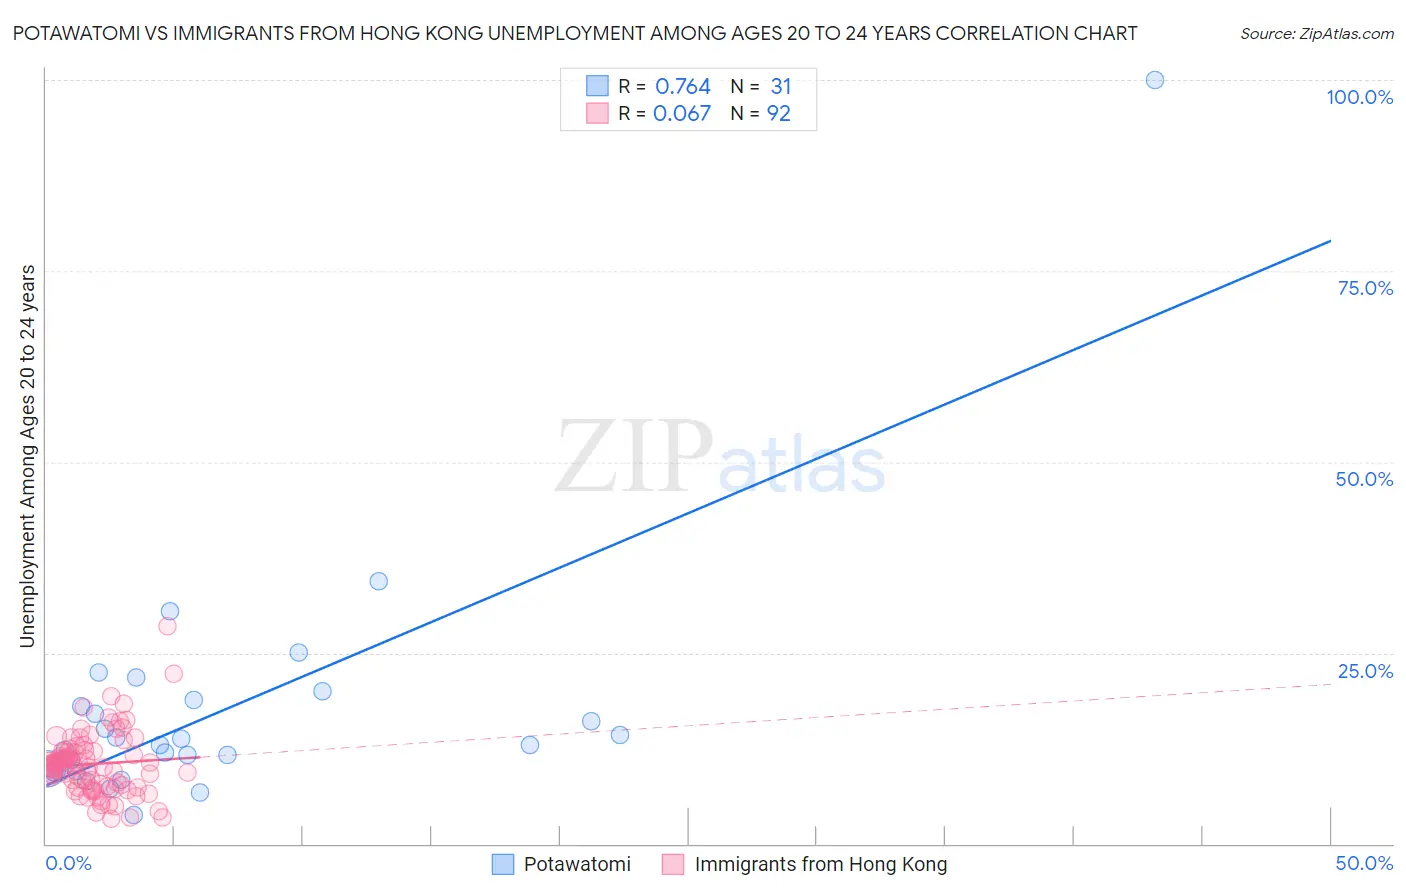
Potawatomi vs Immigrants from Hong Kong Unemployment Among Ages 20 to 24 years Correlation Chart
The statistical analysis conducted on geographies consisting of 115,829,034 people shows a strong positive correlation between the proportion of Potawatomi and unemployment rate among population between the ages 20 and 24 in the United States with a correlation coefficient (R) of 0.764 and weighted average of 10.3%. Similarly, the statistical analysis conducted on geographies consisting of 250,417,372 people shows a slight positive correlation between the proportion of Immigrants from Hong Kong and unemployment rate among population between the ages 20 and 24 in the United States with a correlation coefficient (R) of 0.067 and weighted average of 10.5%, a difference of 1.1%.
Unemployment Among Ages 20 to 24 years Correlation Summary
| Measurement | Potawatomi | Immigrants from Hong Kong |
| Minimum | 3.8% | 3.3% |
| Maximum | 100.0% | 28.4% |
| Range | 96.2% | 25.1% |
| Mean | 17.3% | 10.4% |
| Median | 13.0% | 10.1% |
| Interquartile 25% (IQ1) | 9.5% | 7.5% |
| Interquartile 75% (IQ3) | 18.8% | 12.1% |
| Interquartile Range (IQR) | 9.3% | 4.6% |
| Standard Deviation (Sample) | 16.8% | 4.1% |
| Standard Deviation (Population) | 16.5% | 4.1% |
Similar Demographics by Unemployment Among Ages 20 to 24 years
Demographics Similar to Potawatomi by Unemployment Among Ages 20 to 24 years
In terms of unemployment among ages 20 to 24 years, the demographic groups most similar to Potawatomi are Immigrants from Czechoslovakia (10.3%, a difference of 0.050%), Alsatian (10.3%, a difference of 0.060%), Tlingit-Haida (10.3%, a difference of 0.090%), Immigrants from Turkey (10.3%, a difference of 0.10%), and Okinawan (10.3%, a difference of 0.11%).
| Demographics | Rating | Rank | Unemployment Among Ages 20 to 24 years |
| Immigrants | Colombia | 56.3 /100 | #169 | Average 10.3% |
| Turks | 55.2 /100 | #170 | Average 10.3% |
| Immigrants | Eastern Asia | 52.7 /100 | #171 | Average 10.3% |
| Koreans | 51.9 /100 | #172 | Average 10.3% |
| Immigrants | Sweden | 50.8 /100 | #173 | Average 10.3% |
| Ukrainians | 50.0 /100 | #174 | Average 10.3% |
| Samoans | 45.4 /100 | #175 | Average 10.3% |
| Potawatomi | 42.0 /100 | #176 | Average 10.3% |
| Immigrants | Czechoslovakia | 40.8 /100 | #177 | Average 10.3% |
| Alsatians | 40.5 /100 | #178 | Average 10.3% |
| Tlingit-Haida | 39.7 /100 | #179 | Fair 10.3% |
| Immigrants | Turkey | 39.3 /100 | #180 | Fair 10.3% |
| Okinawans | 39.1 /100 | #181 | Fair 10.3% |
| Immigrants | Germany | 38.1 /100 | #182 | Fair 10.4% |
| Immigrants | Egypt | 37.4 /100 | #183 | Fair 10.4% |
Demographics Similar to Immigrants from Hong Kong by Unemployment Among Ages 20 to 24 years
In terms of unemployment among ages 20 to 24 years, the demographic groups most similar to Immigrants from Hong Kong are Immigrants from Honduras (10.4%, a difference of 0.020%), Peruvian (10.5%, a difference of 0.030%), Immigrants from Belgium (10.5%, a difference of 0.040%), Immigrants from Europe (10.4%, a difference of 0.060%), and Cypriot (10.4%, a difference of 0.080%).
| Demographics | Rating | Rank | Unemployment Among Ages 20 to 24 years |
| Immigrants | Peru | 21.2 /100 | #201 | Fair 10.4% |
| Immigrants | Middle Africa | 20.9 /100 | #202 | Fair 10.4% |
| South Americans | 20.6 /100 | #203 | Fair 10.4% |
| Immigrants | Northern Europe | 19.5 /100 | #204 | Poor 10.4% |
| Cypriots | 18.9 /100 | #205 | Poor 10.4% |
| Immigrants | Europe | 18.5 /100 | #206 | Poor 10.4% |
| Immigrants | Honduras | 17.9 /100 | #207 | Poor 10.4% |
| Immigrants | Hong Kong | 17.6 /100 | #208 | Poor 10.5% |
| Peruvians | 17.2 /100 | #209 | Poor 10.5% |
| Immigrants | Belgium | 16.9 /100 | #210 | Poor 10.5% |
| Immigrants | Guatemala | 14.6 /100 | #211 | Poor 10.5% |
| Immigrants | Sri Lanka | 14.0 /100 | #212 | Poor 10.5% |
| Guatemalans | 12.2 /100 | #213 | Poor 10.5% |
| Kiowa | 11.7 /100 | #214 | Poor 10.5% |
| Hondurans | 10.5 /100 | #215 | Poor 10.5% |