Immigrants from Portugal vs Immigrants from Hong Kong Unemployment Among Ages 20 to 24 years
COMPARE
Immigrants from Portugal
Immigrants from Hong Kong
Unemployment Among Ages 20 to 24 years
Unemployment Among Ages 20 to 24 years Comparison
Immigrants from Portugal
Immigrants from Hong Kong
10.4%
UNEMPLOYMENT AMONG AGES 20 TO 24 YEARS
25.3/ 100
METRIC RATING
193rd/ 347
METRIC RANK
10.5%
UNEMPLOYMENT AMONG AGES 20 TO 24 YEARS
17.6/ 100
METRIC RATING
208th/ 347
METRIC RANK
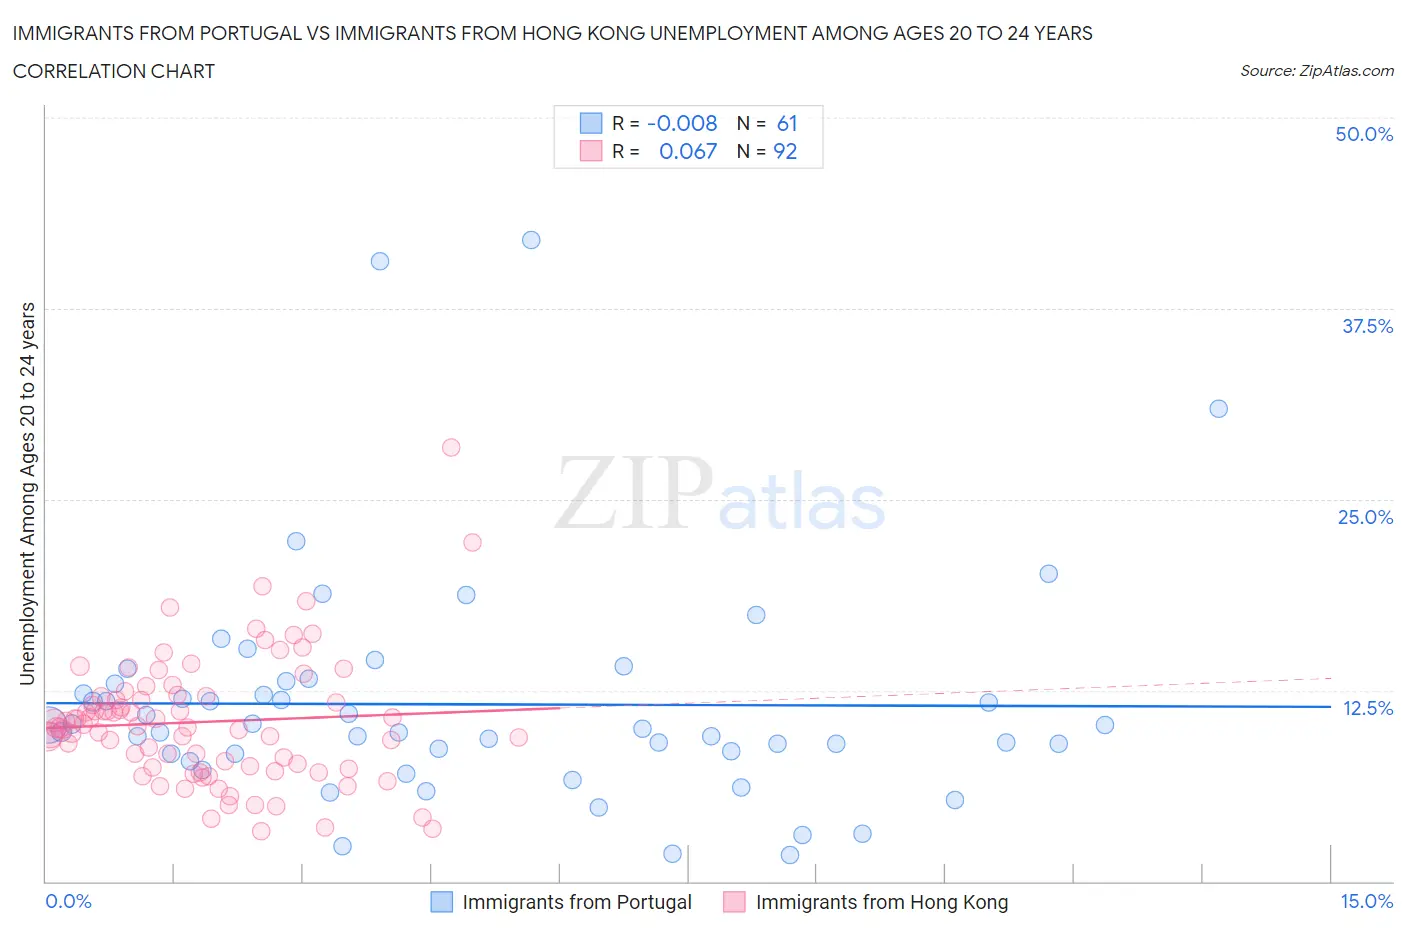
Immigrants from Portugal vs Immigrants from Hong Kong Unemployment Among Ages 20 to 24 years Correlation Chart
The statistical analysis conducted on geographies consisting of 172,080,207 people shows no correlation between the proportion of Immigrants from Portugal and unemployment rate among population between the ages 20 and 24 in the United States with a correlation coefficient (R) of -0.008 and weighted average of 10.4%. Similarly, the statistical analysis conducted on geographies consisting of 250,417,372 people shows a slight positive correlation between the proportion of Immigrants from Hong Kong and unemployment rate among population between the ages 20 and 24 in the United States with a correlation coefficient (R) of 0.067 and weighted average of 10.5%, a difference of 0.42%.
Unemployment Among Ages 20 to 24 years Correlation Summary
| Measurement | Immigrants from Portugal | Immigrants from Hong Kong |
| Minimum | 1.7% | 3.3% |
| Maximum | 42.0% | 28.4% |
| Range | 40.3% | 25.1% |
| Mean | 11.6% | 10.4% |
| Median | 10.0% | 10.1% |
| Interquartile 25% (IQ1) | 8.3% | 7.5% |
| Interquartile 75% (IQ3) | 13.0% | 12.1% |
| Interquartile Range (IQR) | 4.7% | 4.6% |
| Standard Deviation (Sample) | 7.4% | 4.1% |
| Standard Deviation (Population) | 7.4% | 4.1% |
Demographics Similar to Immigrants from Portugal and Immigrants from Hong Kong by Unemployment Among Ages 20 to 24 years
In terms of unemployment among ages 20 to 24 years, the demographic groups most similar to Immigrants from Portugal are Immigrants from Eastern Europe (10.4%, a difference of 0.020%), Ugandan (10.4%, a difference of 0.020%), Immigrants from Italy (10.4%, a difference of 0.020%), Egyptian (10.4%, a difference of 0.040%), and Immigrants from Philippines (10.4%, a difference of 0.060%). Similarly, the demographic groups most similar to Immigrants from Hong Kong are Immigrants from Honduras (10.4%, a difference of 0.020%), Peruvian (10.5%, a difference of 0.030%), Immigrants from Belgium (10.5%, a difference of 0.040%), Immigrants from Europe (10.4%, a difference of 0.060%), and Cypriot (10.4%, a difference of 0.080%).
| Demographics | Rating | Rank | Unemployment Among Ages 20 to 24 years |
| Immigrants | China | 32.6 /100 | #190 | Fair 10.4% |
| Immigrants | Eastern Europe | 25.8 /100 | #191 | Fair 10.4% |
| Ugandans | 25.7 /100 | #192 | Fair 10.4% |
| Immigrants | Portugal | 25.3 /100 | #193 | Fair 10.4% |
| Immigrants | Italy | 25.0 /100 | #194 | Fair 10.4% |
| Egyptians | 24.5 /100 | #195 | Fair 10.4% |
| Immigrants | Philippines | 24.1 /100 | #196 | Fair 10.4% |
| Immigrants | Denmark | 22.8 /100 | #197 | Fair 10.4% |
| Colombians | 22.3 /100 | #198 | Fair 10.4% |
| Portuguese | 21.8 /100 | #199 | Fair 10.4% |
| Russians | 21.2 /100 | #200 | Fair 10.4% |
| Immigrants | Peru | 21.2 /100 | #201 | Fair 10.4% |
| Immigrants | Middle Africa | 20.9 /100 | #202 | Fair 10.4% |
| South Americans | 20.6 /100 | #203 | Fair 10.4% |
| Immigrants | Northern Europe | 19.5 /100 | #204 | Poor 10.4% |
| Cypriots | 18.9 /100 | #205 | Poor 10.4% |
| Immigrants | Europe | 18.5 /100 | #206 | Poor 10.4% |
| Immigrants | Honduras | 17.9 /100 | #207 | Poor 10.4% |
| Immigrants | Hong Kong | 17.6 /100 | #208 | Poor 10.5% |
| Peruvians | 17.2 /100 | #209 | Poor 10.5% |
| Immigrants | Belgium | 16.9 /100 | #210 | Poor 10.5% |