Potawatomi vs Immigrants from El Salvador Unemployment Among Ages 65 to 74 years
COMPARE
Potawatomi
Immigrants from El Salvador
Unemployment Among Ages 65 to 74 years
Unemployment Among Ages 65 to 74 years Comparison
Potawatomi
Immigrants from El Salvador
5.4%
UNEMPLOYMENT AMONG AGES 65 TO 74 YEARS
50.0/ 100
METRIC RATING
174th/ 347
METRIC RANK
5.9%
UNEMPLOYMENT AMONG AGES 65 TO 74 YEARS
0.0/ 100
METRIC RATING
316th/ 347
METRIC RANK
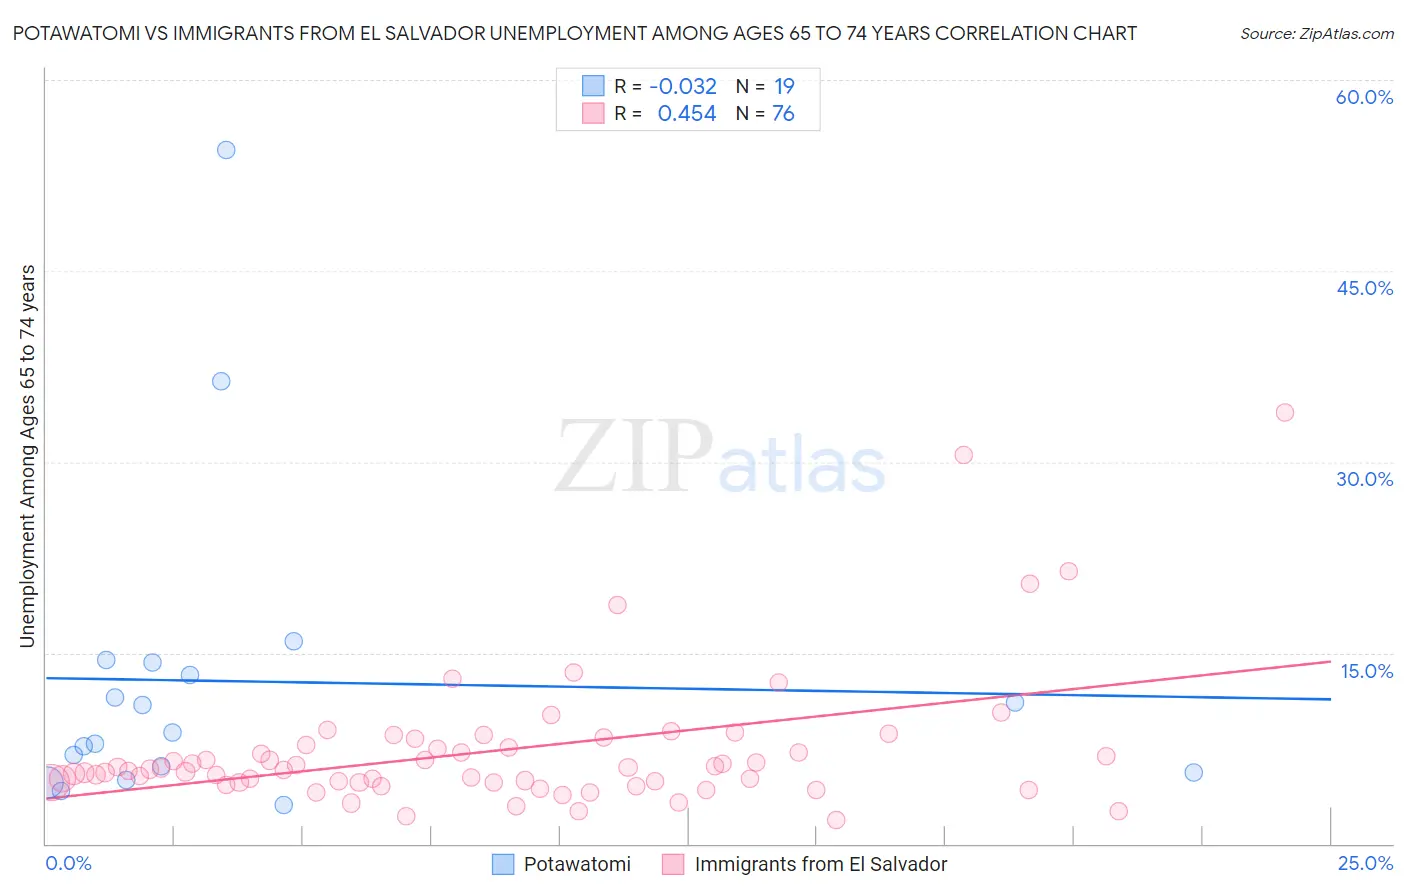
Potawatomi vs Immigrants from El Salvador Unemployment Among Ages 65 to 74 years Correlation Chart
The statistical analysis conducted on geographies consisting of 109,293,263 people shows no correlation between the proportion of Potawatomi and unemployment rate among population between the ages 65 and 74 in the United States with a correlation coefficient (R) of -0.032 and weighted average of 5.4%. Similarly, the statistical analysis conducted on geographies consisting of 318,434,053 people shows a moderate positive correlation between the proportion of Immigrants from El Salvador and unemployment rate among population between the ages 65 and 74 in the United States with a correlation coefficient (R) of 0.454 and weighted average of 5.9%, a difference of 9.9%.
Unemployment Among Ages 65 to 74 years Correlation Summary
| Measurement | Potawatomi | Immigrants from El Salvador |
| Minimum | 3.0% | 1.9% |
| Maximum | 54.5% | 33.9% |
| Range | 51.5% | 32.0% |
| Mean | 12.7% | 7.3% |
| Median | 8.7% | 5.8% |
| Interquartile 25% (IQ1) | 5.6% | 4.8% |
| Interquartile 75% (IQ3) | 14.3% | 7.7% |
| Interquartile Range (IQR) | 8.7% | 2.9% |
| Standard Deviation (Sample) | 12.5% | 5.5% |
| Standard Deviation (Population) | 12.2% | 5.4% |
Similar Demographics by Unemployment Among Ages 65 to 74 years
Demographics Similar to Potawatomi by Unemployment Among Ages 65 to 74 years
In terms of unemployment among ages 65 to 74 years, the demographic groups most similar to Potawatomi are Immigrants from Iran (5.4%, a difference of 0.030%), Greek (5.4%, a difference of 0.040%), Immigrants from Northern Europe (5.4%, a difference of 0.040%), Panamanian (5.4%, a difference of 0.060%), and Immigrants from Western Europe (5.4%, a difference of 0.090%).
| Demographics | Rating | Rank | Unemployment Among Ages 65 to 74 years |
| Indians (Asian) | 59.9 /100 | #167 | Average 5.3% |
| Whites/Caucasians | 57.2 /100 | #168 | Average 5.4% |
| Laotians | 55.7 /100 | #169 | Average 5.4% |
| Syrians | 53.7 /100 | #170 | Average 5.4% |
| Panamanians | 51.8 /100 | #171 | Average 5.4% |
| Greeks | 51.1 /100 | #172 | Average 5.4% |
| Immigrants | Northern Europe | 51.1 /100 | #173 | Average 5.4% |
| Potawatomi | 50.0 /100 | #174 | Average 5.4% |
| Immigrants | Iran | 49.0 /100 | #175 | Average 5.4% |
| Immigrants | Western Europe | 47.3 /100 | #176 | Average 5.4% |
| Arabs | 46.8 /100 | #177 | Average 5.4% |
| French | 43.1 /100 | #178 | Average 5.4% |
| Guamanians/Chamorros | 42.1 /100 | #179 | Average 5.4% |
| Immigrants | Ireland | 42.0 /100 | #180 | Average 5.4% |
| Soviet Union | 40.0 /100 | #181 | Fair 5.4% |
Demographics Similar to Immigrants from El Salvador by Unemployment Among Ages 65 to 74 years
In terms of unemployment among ages 65 to 74 years, the demographic groups most similar to Immigrants from El Salvador are Immigrants from Guatemala (5.9%, a difference of 0.32%), Immigrants from Venezuela (5.9%, a difference of 0.33%), Immigrants from Central America (5.9%, a difference of 0.49%), Vietnamese (5.9%, a difference of 0.51%), and Hispanic or Latino (5.9%, a difference of 0.70%).
| Demographics | Rating | Rank | Unemployment Among Ages 65 to 74 years |
| Immigrants | Ecuador | 0.0 /100 | #309 | Tragic 5.8% |
| Immigrants | Bangladesh | 0.0 /100 | #310 | Tragic 5.9% |
| Venezuelans | 0.0 /100 | #311 | Tragic 5.9% |
| Hispanics or Latinos | 0.0 /100 | #312 | Tragic 5.9% |
| Vietnamese | 0.0 /100 | #313 | Tragic 5.9% |
| Immigrants | Venezuela | 0.0 /100 | #314 | Tragic 5.9% |
| Immigrants | Guatemala | 0.0 /100 | #315 | Tragic 5.9% |
| Immigrants | El Salvador | 0.0 /100 | #316 | Tragic 5.9% |
| Immigrants | Central America | 0.0 /100 | #317 | Tragic 5.9% |
| Zimbabweans | 0.0 /100 | #318 | Tragic 5.9% |
| Aleuts | 0.0 /100 | #319 | Tragic 5.9% |
| Immigrants | Bahamas | 0.0 /100 | #320 | Tragic 5.9% |
| Immigrants | Dominica | 0.0 /100 | #321 | Tragic 6.0% |
| Immigrants | Mexico | 0.0 /100 | #322 | Tragic 6.0% |
| Delaware | 0.0 /100 | #323 | Tragic 6.0% |