Iroquois vs Immigrants from El Salvador Unemployment Among Ages 65 to 74 years
COMPARE
Iroquois
Immigrants from El Salvador
Unemployment Among Ages 65 to 74 years
Unemployment Among Ages 65 to 74 years Comparison
Iroquois
Immigrants from El Salvador
5.1%
UNEMPLOYMENT AMONG AGES 65 TO 74 YEARS
99.3/ 100
METRIC RATING
66th/ 347
METRIC RANK
5.9%
UNEMPLOYMENT AMONG AGES 65 TO 74 YEARS
0.0/ 100
METRIC RATING
316th/ 347
METRIC RANK
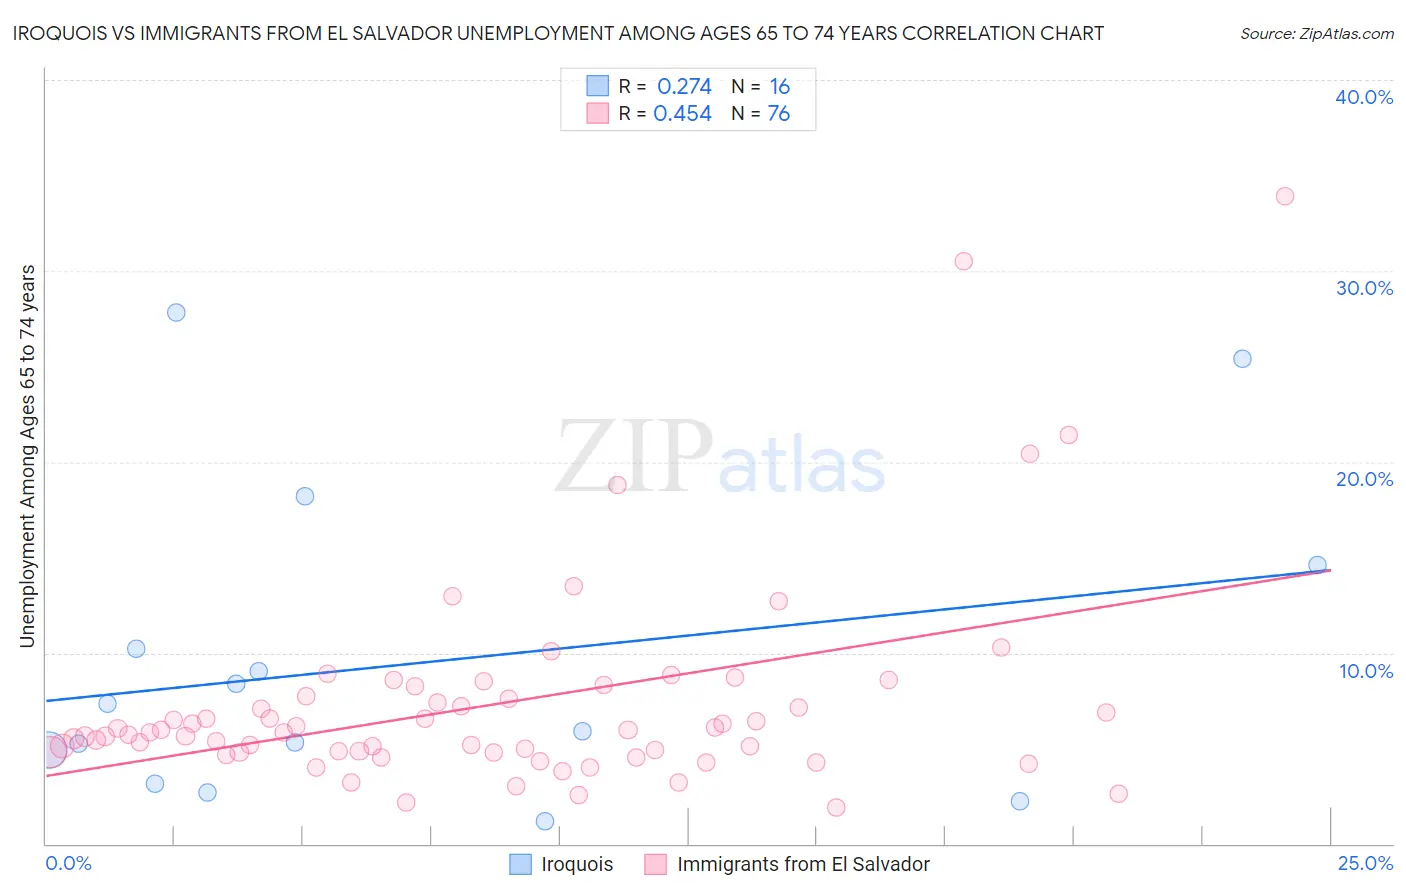
Iroquois vs Immigrants from El Salvador Unemployment Among Ages 65 to 74 years Correlation Chart
The statistical analysis conducted on geographies consisting of 187,561,748 people shows a weak positive correlation between the proportion of Iroquois and unemployment rate among population between the ages 65 and 74 in the United States with a correlation coefficient (R) of 0.274 and weighted average of 5.1%. Similarly, the statistical analysis conducted on geographies consisting of 318,434,053 people shows a moderate positive correlation between the proportion of Immigrants from El Salvador and unemployment rate among population between the ages 65 and 74 in the United States with a correlation coefficient (R) of 0.454 and weighted average of 5.9%, a difference of 14.5%.
Unemployment Among Ages 65 to 74 years Correlation Summary
| Measurement | Iroquois | Immigrants from El Salvador |
| Minimum | 1.2% | 1.9% |
| Maximum | 27.8% | 33.9% |
| Range | 26.6% | 32.0% |
| Mean | 9.5% | 7.3% |
| Median | 6.6% | 5.8% |
| Interquartile 25% (IQ1) | 4.0% | 4.8% |
| Interquartile 75% (IQ3) | 12.4% | 7.7% |
| Interquartile Range (IQR) | 8.4% | 2.9% |
| Standard Deviation (Sample) | 8.1% | 5.5% |
| Standard Deviation (Population) | 7.8% | 5.4% |
Similar Demographics by Unemployment Among Ages 65 to 74 years
Demographics Similar to Iroquois by Unemployment Among Ages 65 to 74 years
In terms of unemployment among ages 65 to 74 years, the demographic groups most similar to Iroquois are Immigrants from Moldova (5.1%, a difference of 0.040%), Bolivian (5.1%, a difference of 0.040%), Swiss (5.1%, a difference of 0.050%), Latvian (5.1%, a difference of 0.060%), and Kiowa (5.1%, a difference of 0.090%).
| Demographics | Rating | Rank | Unemployment Among Ages 65 to 74 years |
| Immigrants | Bulgaria | 99.4 /100 | #59 | Exceptional 5.1% |
| Immigrants | Jordan | 99.4 /100 | #60 | Exceptional 5.1% |
| Immigrants | Taiwan | 99.4 /100 | #61 | Exceptional 5.1% |
| Nicaraguans | 99.4 /100 | #62 | Exceptional 5.1% |
| Kiowa | 99.3 /100 | #63 | Exceptional 5.1% |
| Immigrants | Moldova | 99.3 /100 | #64 | Exceptional 5.1% |
| Bolivians | 99.3 /100 | #65 | Exceptional 5.1% |
| Iroquois | 99.3 /100 | #66 | Exceptional 5.1% |
| Swiss | 99.2 /100 | #67 | Exceptional 5.1% |
| Latvians | 99.2 /100 | #68 | Exceptional 5.1% |
| Scandinavians | 99.1 /100 | #69 | Exceptional 5.2% |
| Immigrants | Japan | 99.1 /100 | #70 | Exceptional 5.2% |
| Scotch-Irish | 99.0 /100 | #71 | Exceptional 5.2% |
| Immigrants | Oceania | 99.0 /100 | #72 | Exceptional 5.2% |
| Filipinos | 99.0 /100 | #73 | Exceptional 5.2% |
Demographics Similar to Immigrants from El Salvador by Unemployment Among Ages 65 to 74 years
In terms of unemployment among ages 65 to 74 years, the demographic groups most similar to Immigrants from El Salvador are Immigrants from Guatemala (5.9%, a difference of 0.32%), Immigrants from Venezuela (5.9%, a difference of 0.33%), Immigrants from Central America (5.9%, a difference of 0.49%), Vietnamese (5.9%, a difference of 0.51%), and Hispanic or Latino (5.9%, a difference of 0.70%).
| Demographics | Rating | Rank | Unemployment Among Ages 65 to 74 years |
| Immigrants | Ecuador | 0.0 /100 | #309 | Tragic 5.8% |
| Immigrants | Bangladesh | 0.0 /100 | #310 | Tragic 5.9% |
| Venezuelans | 0.0 /100 | #311 | Tragic 5.9% |
| Hispanics or Latinos | 0.0 /100 | #312 | Tragic 5.9% |
| Vietnamese | 0.0 /100 | #313 | Tragic 5.9% |
| Immigrants | Venezuela | 0.0 /100 | #314 | Tragic 5.9% |
| Immigrants | Guatemala | 0.0 /100 | #315 | Tragic 5.9% |
| Immigrants | El Salvador | 0.0 /100 | #316 | Tragic 5.9% |
| Immigrants | Central America | 0.0 /100 | #317 | Tragic 5.9% |
| Zimbabweans | 0.0 /100 | #318 | Tragic 5.9% |
| Aleuts | 0.0 /100 | #319 | Tragic 5.9% |
| Immigrants | Bahamas | 0.0 /100 | #320 | Tragic 5.9% |
| Immigrants | Dominica | 0.0 /100 | #321 | Tragic 6.0% |
| Immigrants | Mexico | 0.0 /100 | #322 | Tragic 6.0% |
| Delaware | 0.0 /100 | #323 | Tragic 6.0% |