Potawatomi vs Immigrants from Chile Unemployment Among Seniors over 75 years
COMPARE
Potawatomi
Immigrants from Chile
Unemployment Among Seniors over 75 years
Unemployment Among Seniors over 75 years Comparison
Potawatomi
Immigrants from Chile
7.8%
UNEMPLOYMENT AMONG SENIORS OVER 75 YEARS
100.0/ 100
METRIC RATING
49th/ 347
METRIC RANK
7.8%
UNEMPLOYMENT AMONG SENIORS OVER 75 YEARS
100.0/ 100
METRIC RATING
48th/ 347
METRIC RANK
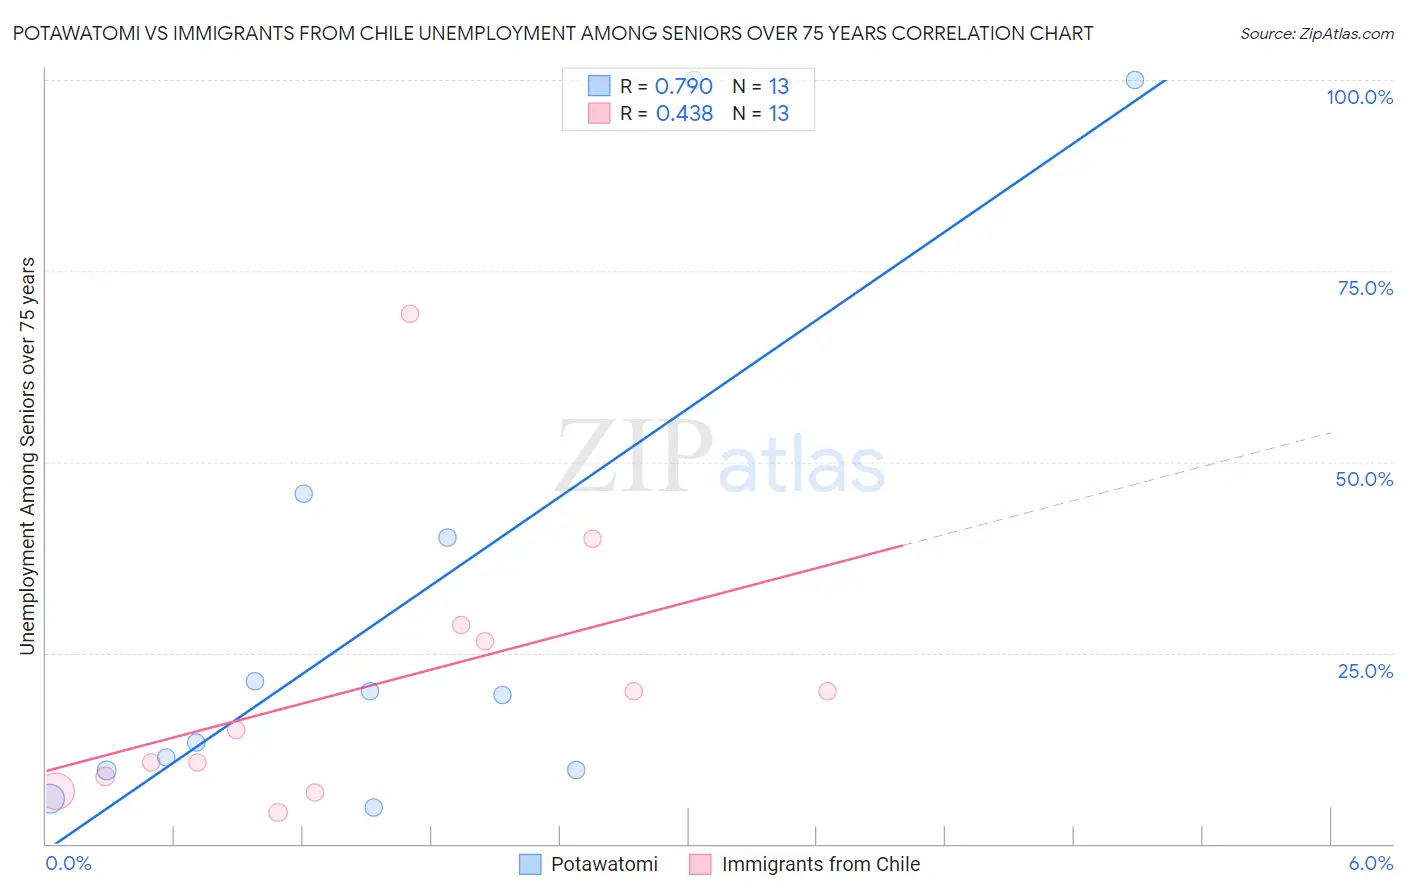
Potawatomi vs Immigrants from Chile Unemployment Among Seniors over 75 years Correlation Chart
The statistical analysis conducted on geographies consisting of 81,881,728 people shows a strong positive correlation between the proportion of Potawatomi and unemployment rate among seniors over the age of 75 in the United States with a correlation coefficient (R) of 0.790 and weighted average of 7.8%. Similarly, the statistical analysis conducted on geographies consisting of 139,456,025 people shows a moderate positive correlation between the proportion of Immigrants from Chile and unemployment rate among seniors over the age of 75 in the United States with a correlation coefficient (R) of 0.438 and weighted average of 7.8%, a difference of 0.030%.
Unemployment Among Seniors over 75 years Correlation Summary
| Measurement | Potawatomi | Immigrants from Chile |
| Minimum | 4.7% | 4.2% |
| Maximum | 100.0% | 69.3% |
| Range | 95.3% | 65.1% |
| Mean | 30.9% | 20.5% |
| Median | 19.4% | 14.9% |
| Interquartile 25% (IQ1) | 9.6% | 7.8% |
| Interquartile 75% (IQ3) | 43.0% | 27.6% |
| Interquartile Range (IQR) | 33.4% | 19.7% |
| Standard Deviation (Sample) | 33.1% | 18.0% |
| Standard Deviation (Population) | 31.8% | 17.3% |
Demographics Similar to Potawatomi and Immigrants from Chile by Unemployment Among Seniors over 75 years
In terms of unemployment among seniors over 75 years, the demographic groups most similar to Potawatomi are Immigrants from Latvia (7.8%, a difference of 0.020%), Moroccan (7.8%, a difference of 0.080%), Creek (7.8%, a difference of 0.26%), Bahamian (7.8%, a difference of 0.32%), and Immigrants from Egypt (7.9%, a difference of 0.39%). Similarly, the demographic groups most similar to Immigrants from Chile are Immigrants from Latvia (7.8%, a difference of 0.050%), Moroccan (7.8%, a difference of 0.11%), Creek (7.8%, a difference of 0.22%), Bahamian (7.8%, a difference of 0.35%), and Immigrants from Egypt (7.9%, a difference of 0.42%).
| Demographics | Rating | Rank | Unemployment Among Seniors over 75 years |
| Kiowa | 100.0 /100 | #38 | Exceptional 7.7% |
| Ugandans | 100.0 /100 | #39 | Exceptional 7.7% |
| Colville | 100.0 /100 | #40 | Exceptional 7.7% |
| Immigrants | Burma/Myanmar | 100.0 /100 | #41 | Exceptional 7.7% |
| Pueblo | 100.0 /100 | #42 | Exceptional 7.7% |
| Immigrants | Denmark | 100.0 /100 | #43 | Exceptional 7.8% |
| Immigrants | Spain | 100.0 /100 | #44 | Exceptional 7.8% |
| British West Indians | 100.0 /100 | #45 | Exceptional 7.8% |
| Immigrants | China | 100.0 /100 | #46 | Exceptional 7.8% |
| Creek | 100.0 /100 | #47 | Exceptional 7.8% |
| Immigrants | Chile | 100.0 /100 | #48 | Exceptional 7.8% |
| Potawatomi | 100.0 /100 | #49 | Exceptional 7.8% |
| Immigrants | Latvia | 100.0 /100 | #50 | Exceptional 7.8% |
| Moroccans | 100.0 /100 | #51 | Exceptional 7.8% |
| Bahamians | 100.0 /100 | #52 | Exceptional 7.8% |
| Immigrants | Egypt | 100.0 /100 | #53 | Exceptional 7.9% |
| Immigrants | Malaysia | 99.9 /100 | #54 | Exceptional 7.9% |
| Filipinos | 99.9 /100 | #55 | Exceptional 7.9% |
| Immigrants | Eastern Asia | 99.9 /100 | #56 | Exceptional 7.9% |
| Ottawa | 99.9 /100 | #57 | Exceptional 7.9% |
| Iranians | 99.9 /100 | #58 | Exceptional 7.9% |