Portuguese vs Immigrants from Sri Lanka Unemployment Among Ages 55 to 59 years
COMPARE
Portuguese
Immigrants from Sri Lanka
Unemployment Among Ages 55 to 59 years
Unemployment Among Ages 55 to 59 years Comparison
Portuguese
Immigrants from Sri Lanka
5.1%
UNEMPLOYMENT AMONG AGES 55 TO 59 YEARS
0.3/ 100
METRIC RATING
251st/ 347
METRIC RANK
4.8%
UNEMPLOYMENT AMONG AGES 55 TO 59 YEARS
46.8/ 100
METRIC RATING
177th/ 347
METRIC RANK
Portuguese vs Immigrants from Sri Lanka Unemployment Among Ages 55 to 59 years Correlation Chart
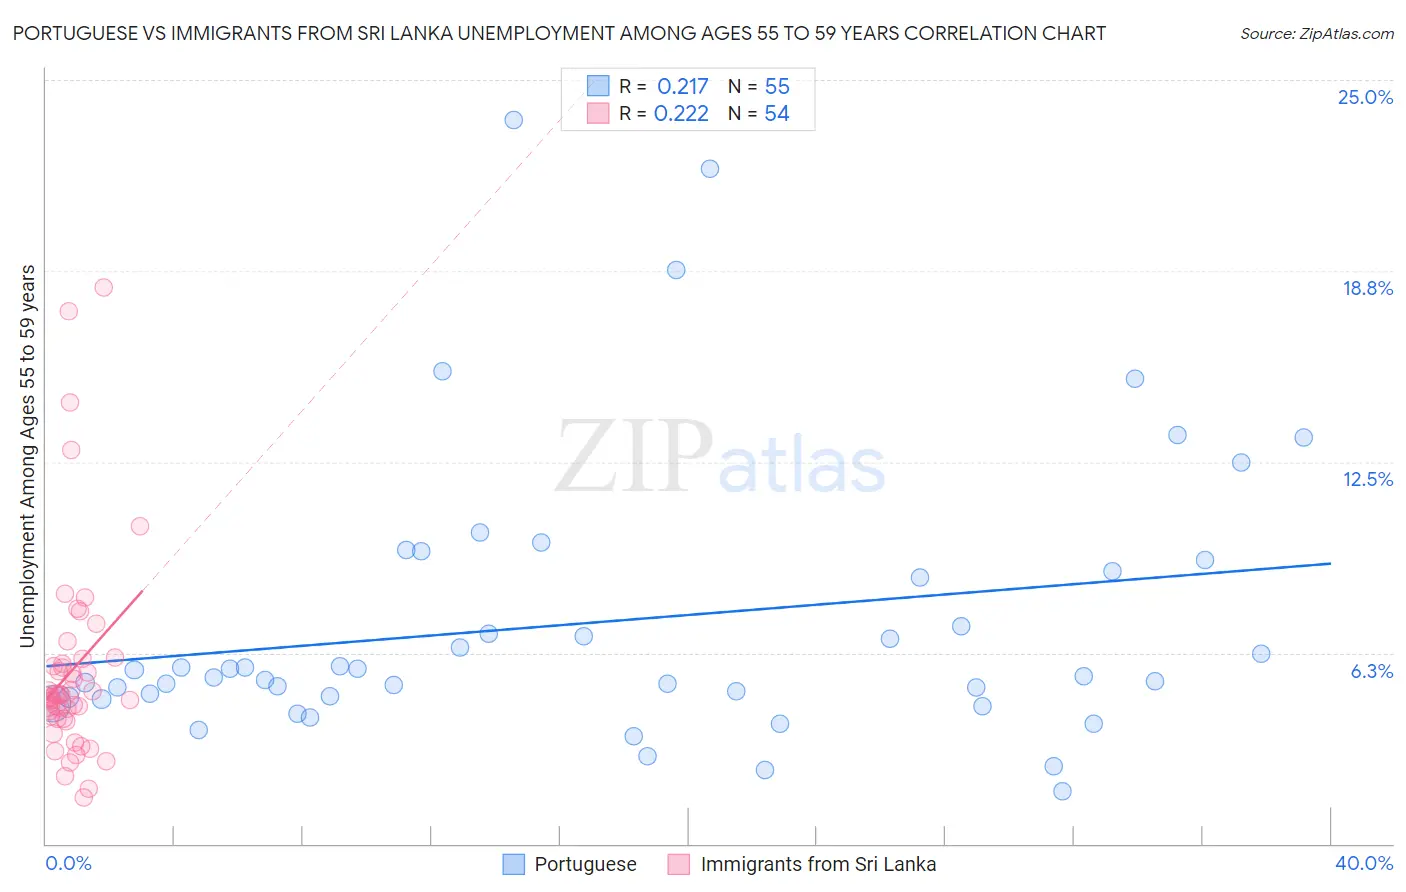
The statistical analysis conducted on geographies consisting of 411,134,839 people shows a weak positive correlation between the proportion of Portuguese and unemployment rate among population between the ages 55 and 59 in the United States with a correlation coefficient (R) of 0.217 and weighted average of 5.1%. Similarly, the statistical analysis conducted on geographies consisting of 145,961,624 people shows a weak positive correlation between the proportion of Immigrants from Sri Lanka and unemployment rate among population between the ages 55 and 59 in the United States with a correlation coefficient (R) of 0.222 and weighted average of 4.8%, a difference of 5.6%.
Unemployment Among Ages 55 to 59 years Correlation Summary
| Measurement | Portuguese | Immigrants from Sri Lanka |
| Minimum | 1.7% | 1.5% |
| Maximum | 23.7% | 18.2% |
| Range | 22.0% | 16.7% |
| Mean | 7.3% | 5.7% |
| Median | 5.5% | 4.8% |
| Interquartile 25% (IQ1) | 4.8% | 4.1% |
| Interquartile 75% (IQ3) | 8.9% | 5.9% |
| Interquartile Range (IQR) | 4.1% | 1.8% |
| Standard Deviation (Sample) | 4.6% | 3.4% |
| Standard Deviation (Population) | 4.6% | 3.3% |
Similar Demographics by Unemployment Among Ages 55 to 59 years
Demographics Similar to Portuguese by Unemployment Among Ages 55 to 59 years
In terms of unemployment among ages 55 to 59 years, the demographic groups most similar to Portuguese are U.S. Virgin Islander (5.1%, a difference of 0.020%), Paraguayan (5.1%, a difference of 0.060%), Cheyenne (5.1%, a difference of 0.070%), Seminole (5.1%, a difference of 0.090%), and Blackfeet (5.1%, a difference of 0.16%).
| Demographics | Rating | Rank | Unemployment Among Ages 55 to 59 years |
| Immigrants | Fiji | 0.7 /100 | #244 | Tragic 5.1% |
| Soviet Union | 0.6 /100 | #245 | Tragic 5.1% |
| Immigrants | Greece | 0.6 /100 | #246 | Tragic 5.1% |
| Immigrants | Honduras | 0.5 /100 | #247 | Tragic 5.1% |
| Native Hawaiians | 0.5 /100 | #248 | Tragic 5.1% |
| Comanche | 0.4 /100 | #249 | Tragic 5.1% |
| Cheyenne | 0.4 /100 | #250 | Tragic 5.1% |
| Portuguese | 0.3 /100 | #251 | Tragic 5.1% |
| U.S. Virgin Islanders | 0.3 /100 | #252 | Tragic 5.1% |
| Paraguayans | 0.3 /100 | #253 | Tragic 5.1% |
| Seminole | 0.3 /100 | #254 | Tragic 5.1% |
| Blackfeet | 0.3 /100 | #255 | Tragic 5.1% |
| Senegalese | 0.3 /100 | #256 | Tragic 5.1% |
| Central Americans | 0.2 /100 | #257 | Tragic 5.1% |
| Salvadorans | 0.2 /100 | #258 | Tragic 5.1% |
Demographics Similar to Immigrants from Sri Lanka by Unemployment Among Ages 55 to 59 years
In terms of unemployment among ages 55 to 59 years, the demographic groups most similar to Immigrants from Sri Lanka are Samoan (4.8%, a difference of 0.010%), Australian (4.8%, a difference of 0.070%), Arab (4.8%, a difference of 0.090%), Hungarian (4.8%, a difference of 0.10%), and South American (4.8%, a difference of 0.12%).
| Demographics | Rating | Rank | Unemployment Among Ages 55 to 59 years |
| Uruguayans | 55.6 /100 | #170 | Average 4.8% |
| Japanese | 54.5 /100 | #171 | Average 4.8% |
| Nicaraguans | 54.0 /100 | #172 | Average 4.8% |
| Immigrants | Eastern Europe | 52.2 /100 | #173 | Average 4.8% |
| Immigrants | Croatia | 50.0 /100 | #174 | Average 4.8% |
| Australians | 48.6 /100 | #175 | Average 4.8% |
| Samoans | 47.1 /100 | #176 | Average 4.8% |
| Immigrants | Sri Lanka | 46.8 /100 | #177 | Average 4.8% |
| Arabs | 44.7 /100 | #178 | Average 4.8% |
| Hungarians | 44.3 /100 | #179 | Average 4.8% |
| South Americans | 44.0 /100 | #180 | Average 4.8% |
| Immigrants | Hungary | 40.4 /100 | #181 | Average 4.8% |
| Immigrants | Europe | 40.4 /100 | #182 | Average 4.8% |
| Immigrants | Peru | 38.6 /100 | #183 | Fair 4.8% |
| Immigrants | Czechoslovakia | 38.0 /100 | #184 | Fair 4.8% |