Portuguese vs Immigrants from Southern Europe Unemployment Among Ages 55 to 59 years
COMPARE
Portuguese
Immigrants from Southern Europe
Unemployment Among Ages 55 to 59 years
Unemployment Among Ages 55 to 59 years Comparison
Portuguese
Immigrants from Southern Europe
5.1%
UNEMPLOYMENT AMONG AGES 55 TO 59 YEARS
0.3/ 100
METRIC RATING
251st/ 347
METRIC RANK
5.0%
UNEMPLOYMENT AMONG AGES 55 TO 59 YEARS
1.8/ 100
METRIC RATING
234th/ 347
METRIC RANK
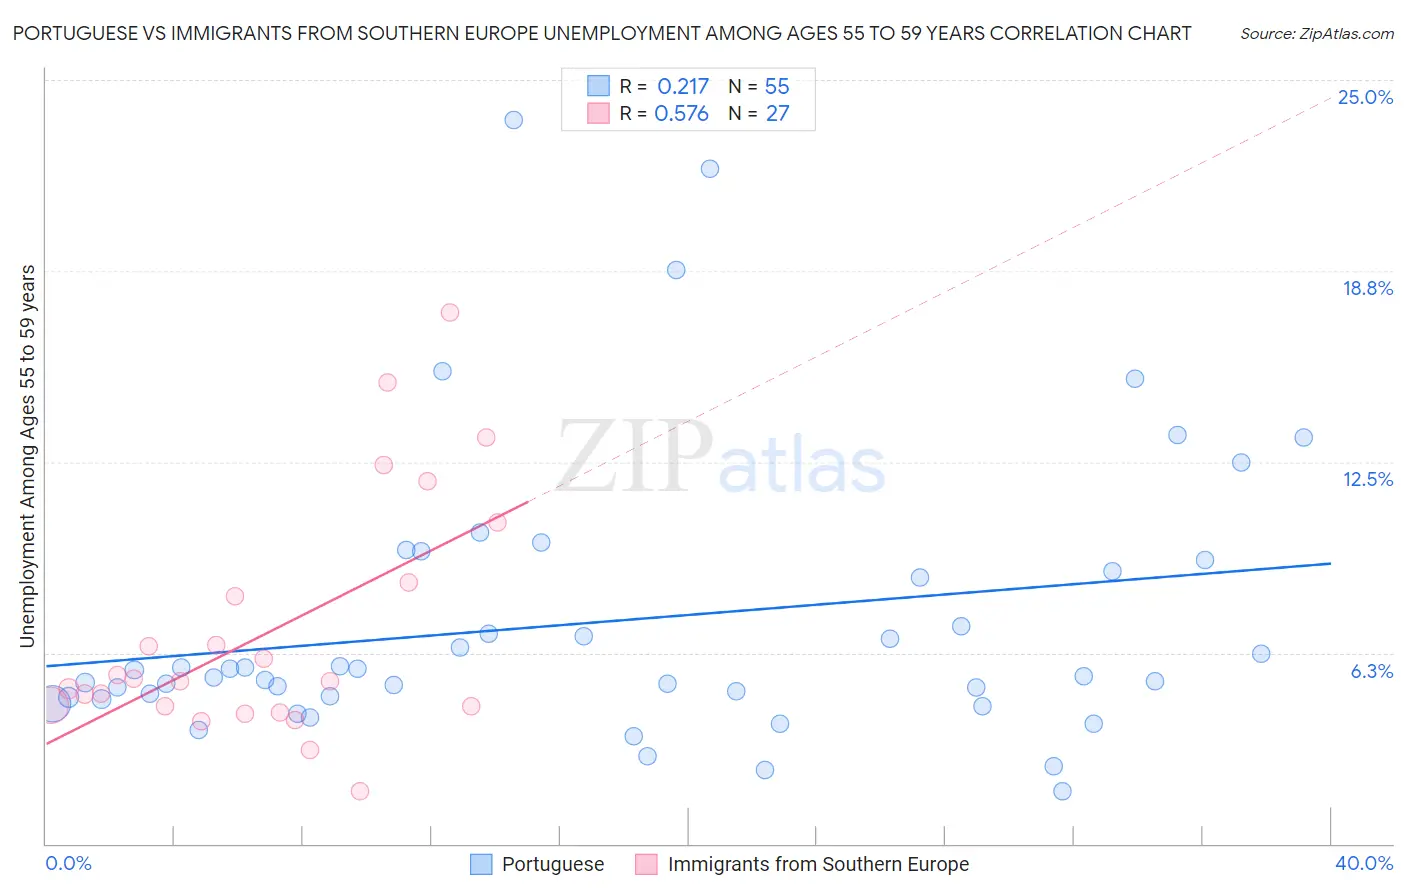
Portuguese vs Immigrants from Southern Europe Unemployment Among Ages 55 to 59 years Correlation Chart
The statistical analysis conducted on geographies consisting of 411,134,839 people shows a weak positive correlation between the proportion of Portuguese and unemployment rate among population between the ages 55 and 59 in the United States with a correlation coefficient (R) of 0.217 and weighted average of 5.1%. Similarly, the statistical analysis conducted on geographies consisting of 375,573,900 people shows a substantial positive correlation between the proportion of Immigrants from Southern Europe and unemployment rate among population between the ages 55 and 59 in the United States with a correlation coefficient (R) of 0.576 and weighted average of 5.0%, a difference of 1.7%.
Unemployment Among Ages 55 to 59 years Correlation Summary
| Measurement | Portuguese | Immigrants from Southern Europe |
| Minimum | 1.7% | 1.7% |
| Maximum | 23.7% | 17.4% |
| Range | 22.0% | 15.7% |
| Mean | 7.3% | 6.9% |
| Median | 5.5% | 5.3% |
| Interquartile 25% (IQ1) | 4.8% | 4.5% |
| Interquartile 75% (IQ3) | 8.9% | 8.5% |
| Interquartile Range (IQR) | 4.1% | 4.0% |
| Standard Deviation (Sample) | 4.6% | 3.9% |
| Standard Deviation (Population) | 4.6% | 3.9% |
Demographics Similar to Portuguese and Immigrants from Southern Europe by Unemployment Among Ages 55 to 59 years
In terms of unemployment among ages 55 to 59 years, the demographic groups most similar to Portuguese are U.S. Virgin Islander (5.1%, a difference of 0.020%), Cheyenne (5.1%, a difference of 0.070%), Comanche (5.1%, a difference of 0.25%), Native Hawaiian (5.1%, a difference of 0.28%), and Immigrants from Honduras (5.1%, a difference of 0.45%). Similarly, the demographic groups most similar to Immigrants from Southern Europe are Immigrants from Hong Kong (5.0%, a difference of 0.23%), Immigrants (5.0%, a difference of 0.24%), Albanian (5.0%, a difference of 0.32%), Immigrants from Albania (5.0%, a difference of 0.34%), and Choctaw (5.0%, a difference of 0.35%).
| Demographics | Rating | Rank | Unemployment Among Ages 55 to 59 years |
| Albanians | 2.5 /100 | #232 | Tragic 5.0% |
| Immigrants | Immigrants | 2.3 /100 | #233 | Tragic 5.0% |
| Immigrants | Southern Europe | 1.8 /100 | #234 | Tragic 5.0% |
| Immigrants | Hong Kong | 1.4 /100 | #235 | Tragic 5.0% |
| Immigrants | Albania | 1.3 /100 | #236 | Tragic 5.0% |
| Choctaw | 1.3 /100 | #237 | Tragic 5.0% |
| Moroccans | 1.3 /100 | #238 | Tragic 5.0% |
| French American Indians | 1.2 /100 | #239 | Tragic 5.0% |
| Immigrants | Costa Rica | 1.1 /100 | #240 | Tragic 5.0% |
| Brazilians | 1.0 /100 | #241 | Tragic 5.0% |
| Liberians | 0.9 /100 | #242 | Tragic 5.1% |
| Hondurans | 0.7 /100 | #243 | Tragic 5.1% |
| Immigrants | Fiji | 0.7 /100 | #244 | Tragic 5.1% |
| Soviet Union | 0.6 /100 | #245 | Tragic 5.1% |
| Immigrants | Greece | 0.6 /100 | #246 | Tragic 5.1% |
| Immigrants | Honduras | 0.5 /100 | #247 | Tragic 5.1% |
| Native Hawaiians | 0.5 /100 | #248 | Tragic 5.1% |
| Comanche | 0.4 /100 | #249 | Tragic 5.1% |
| Cheyenne | 0.4 /100 | #250 | Tragic 5.1% |
| Portuguese | 0.3 /100 | #251 | Tragic 5.1% |
| U.S. Virgin Islanders | 0.3 /100 | #252 | Tragic 5.1% |