Polish vs Belgian Unemployment Among Seniors over 75 years
COMPARE
Polish
Belgian
Unemployment Among Seniors over 75 years
Unemployment Among Seniors over 75 years Comparison
Poles
Belgians
10.3%
UNEMPLOYMENT AMONG SENIORS OVER 75 YEARS
0.0/ 100
METRIC RATING
322nd/ 347
METRIC RANK
9.9%
UNEMPLOYMENT AMONG SENIORS OVER 75 YEARS
0.0/ 100
METRIC RATING
299th/ 347
METRIC RANK
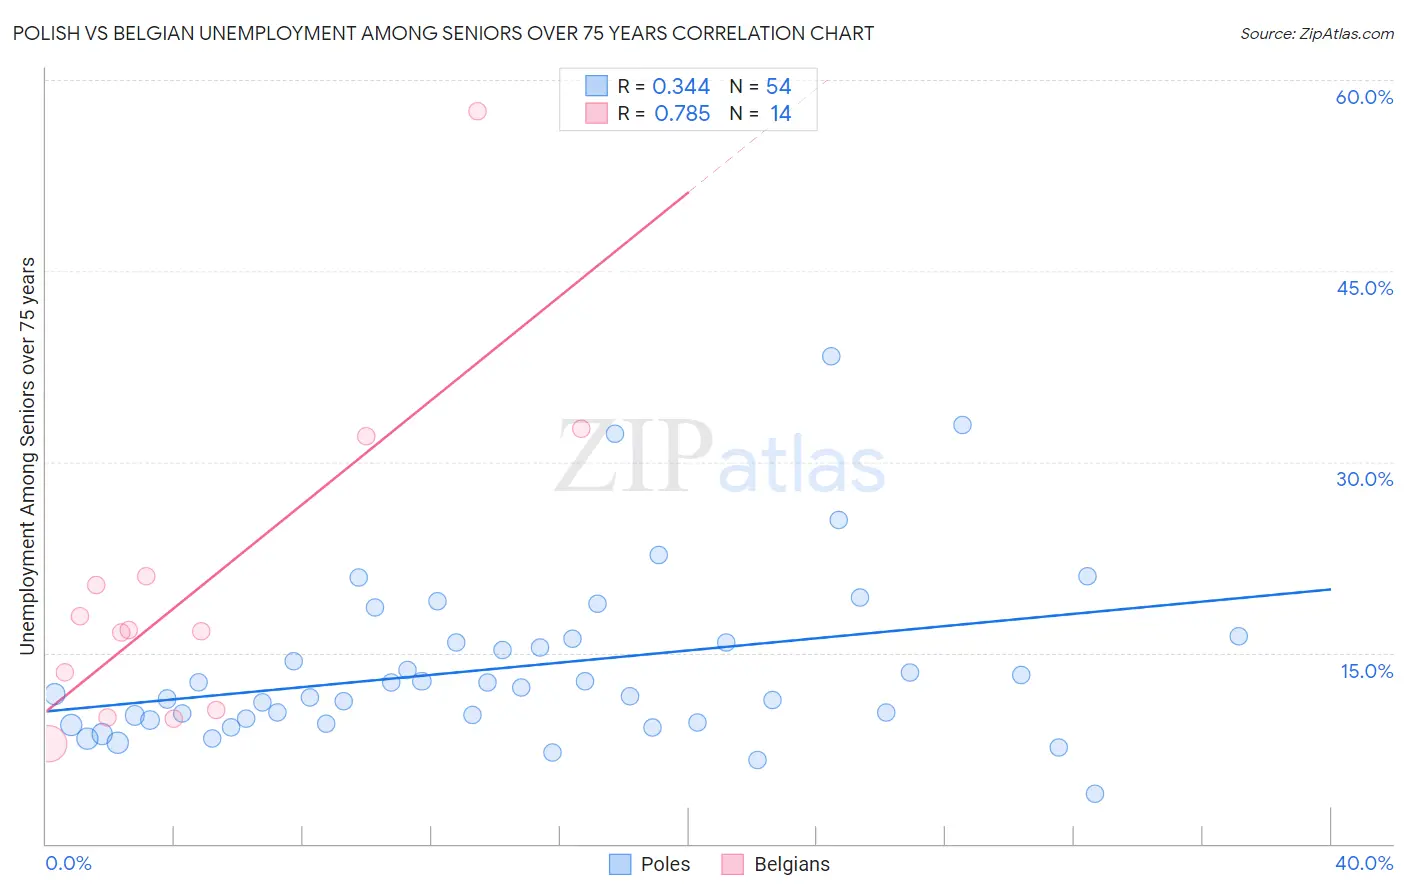
Polish vs Belgian Unemployment Among Seniors over 75 years Correlation Chart
The statistical analysis conducted on geographies consisting of 233,225,718 people shows a mild positive correlation between the proportion of Poles and unemployment rate among seniors over the age of 75 in the United States with a correlation coefficient (R) of 0.344 and weighted average of 10.3%. Similarly, the statistical analysis conducted on geographies consisting of 184,859,103 people shows a strong positive correlation between the proportion of Belgians and unemployment rate among seniors over the age of 75 in the United States with a correlation coefficient (R) of 0.785 and weighted average of 9.9%, a difference of 4.1%.
Unemployment Among Seniors over 75 years Correlation Summary
| Measurement | Polish | Belgian |
| Minimum | 3.9% | 7.8% |
| Maximum | 38.3% | 57.5% |
| Range | 34.4% | 49.7% |
| Mean | 13.9% | 20.2% |
| Median | 12.0% | 16.8% |
| Interquartile 25% (IQ1) | 9.7% | 10.5% |
| Interquartile 75% (IQ3) | 15.9% | 21.0% |
| Interquartile Range (IQR) | 6.1% | 10.5% |
| Standard Deviation (Sample) | 6.7% | 13.1% |
| Standard Deviation (Population) | 6.6% | 12.6% |
Similar Demographics by Unemployment Among Seniors over 75 years
Demographics Similar to Poles by Unemployment Among Seniors over 75 years
In terms of unemployment among seniors over 75 years, the demographic groups most similar to Poles are Aleut (10.3%, a difference of 0.35%), French (10.3%, a difference of 0.37%), German (10.3%, a difference of 0.59%), Tongan (10.4%, a difference of 0.64%), and Liberian (10.2%, a difference of 0.66%).
| Demographics | Rating | Rank | Unemployment Among Seniors over 75 years |
| Pennsylvania Germans | 0.0 /100 | #315 | Tragic 10.2% |
| Natives/Alaskans | 0.0 /100 | #316 | Tragic 10.2% |
| Irish | 0.0 /100 | #317 | Tragic 10.2% |
| Liberians | 0.0 /100 | #318 | Tragic 10.2% |
| Germans | 0.0 /100 | #319 | Tragic 10.3% |
| French | 0.0 /100 | #320 | Tragic 10.3% |
| Aleuts | 0.0 /100 | #321 | Tragic 10.3% |
| Poles | 0.0 /100 | #322 | Tragic 10.3% |
| Tongans | 0.0 /100 | #323 | Tragic 10.4% |
| Americans | 0.0 /100 | #324 | Tragic 10.4% |
| Portuguese | 0.0 /100 | #325 | Tragic 10.4% |
| Slovaks | 0.0 /100 | #326 | Tragic 10.4% |
| Dutch | 0.0 /100 | #327 | Tragic 10.4% |
| Immigrants | Portugal | 0.0 /100 | #328 | Tragic 10.5% |
| Tsimshian | 0.0 /100 | #329 | Tragic 10.5% |
Demographics Similar to Belgians by Unemployment Among Seniors over 75 years
In terms of unemployment among seniors over 75 years, the demographic groups most similar to Belgians are Iraqi (9.9%, a difference of 0.020%), Lithuanian (9.9%, a difference of 0.28%), Welsh (10.0%, a difference of 0.45%), Finnish (10.0%, a difference of 0.55%), and Puget Sound Salish (10.0%, a difference of 0.63%).
| Demographics | Rating | Rank | Unemployment Among Seniors over 75 years |
| Immigrants | Western Africa | 0.0 /100 | #292 | Tragic 9.8% |
| Norwegians | 0.0 /100 | #293 | Tragic 9.8% |
| Immigrants | Dominica | 0.0 /100 | #294 | Tragic 9.8% |
| Immigrants | Nonimmigrants | 0.0 /100 | #295 | Tragic 9.8% |
| Immigrants | St. Vincent and the Grenadines | 0.0 /100 | #296 | Tragic 9.8% |
| Cherokee | 0.0 /100 | #297 | Tragic 9.8% |
| Lithuanians | 0.0 /100 | #298 | Tragic 9.9% |
| Belgians | 0.0 /100 | #299 | Tragic 9.9% |
| Iraqis | 0.0 /100 | #300 | Tragic 9.9% |
| Welsh | 0.0 /100 | #301 | Tragic 10.0% |
| Finns | 0.0 /100 | #302 | Tragic 10.0% |
| Puget Sound Salish | 0.0 /100 | #303 | Tragic 10.0% |
| Scotch-Irish | 0.0 /100 | #304 | Tragic 10.0% |
| Swedes | 0.0 /100 | #305 | Tragic 10.0% |
| Italians | 0.0 /100 | #306 | Tragic 10.0% |