Immigrants from Laos vs Belgian Unemployment Among Seniors over 75 years
COMPARE
Immigrants from Laos
Belgian
Unemployment Among Seniors over 75 years
Unemployment Among Seniors over 75 years Comparison
Immigrants from Laos
Belgians
8.9%
UNEMPLOYMENT AMONG SENIORS OVER 75 YEARS
26.3/ 100
METRIC RATING
197th/ 347
METRIC RANK
9.9%
UNEMPLOYMENT AMONG SENIORS OVER 75 YEARS
0.0/ 100
METRIC RATING
299th/ 347
METRIC RANK
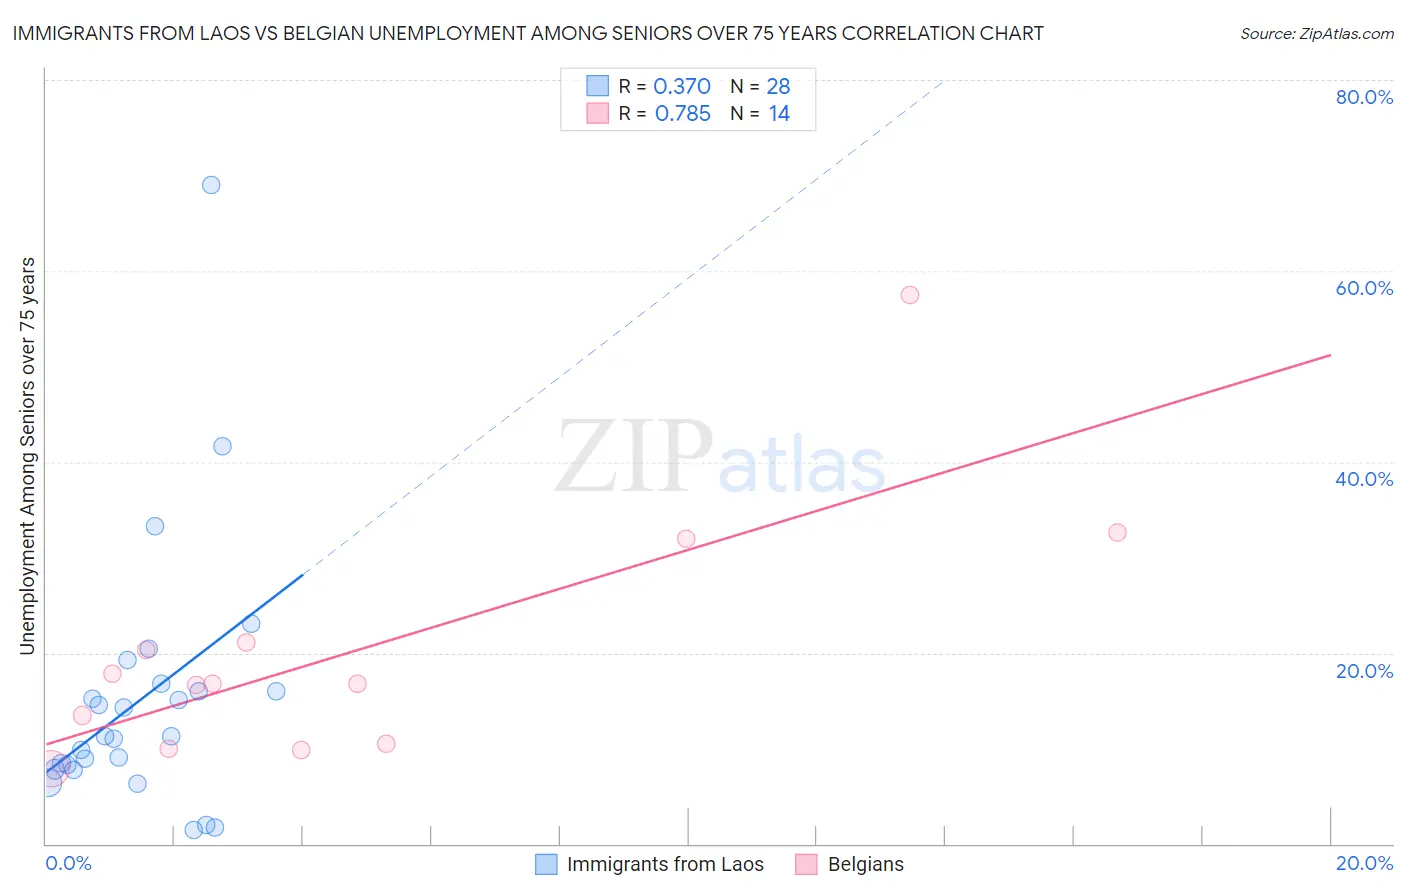
Immigrants from Laos vs Belgian Unemployment Among Seniors over 75 years Correlation Chart
The statistical analysis conducted on geographies consisting of 123,851,723 people shows a mild positive correlation between the proportion of Immigrants from Laos and unemployment rate among seniors over the age of 75 in the United States with a correlation coefficient (R) of 0.370 and weighted average of 8.9%. Similarly, the statistical analysis conducted on geographies consisting of 184,859,103 people shows a strong positive correlation between the proportion of Belgians and unemployment rate among seniors over the age of 75 in the United States with a correlation coefficient (R) of 0.785 and weighted average of 9.9%, a difference of 11.8%.
Unemployment Among Seniors over 75 years Correlation Summary
| Measurement | Immigrants from Laos | Belgian |
| Minimum | 1.4% | 7.8% |
| Maximum | 69.0% | 57.5% |
| Range | 67.6% | 49.7% |
| Mean | 15.2% | 20.2% |
| Median | 11.2% | 16.8% |
| Interquartile 25% (IQ1) | 8.0% | 10.5% |
| Interquartile 75% (IQ3) | 16.4% | 21.0% |
| Interquartile Range (IQR) | 8.4% | 10.5% |
| Standard Deviation (Sample) | 13.7% | 13.1% |
| Standard Deviation (Population) | 13.5% | 12.6% |
Similar Demographics by Unemployment Among Seniors over 75 years
Demographics Similar to Immigrants from Laos by Unemployment Among Seniors over 75 years
In terms of unemployment among seniors over 75 years, the demographic groups most similar to Immigrants from Laos are Eastern European (8.9%, a difference of 0.030%), Pakistani (8.9%, a difference of 0.060%), Osage (8.9%, a difference of 0.060%), Immigrants from Jamaica (8.9%, a difference of 0.10%), and Immigrants from Peru (8.9%, a difference of 0.14%).
| Demographics | Rating | Rank | Unemployment Among Seniors over 75 years |
| Mexican American Indians | 34.7 /100 | #190 | Fair 8.8% |
| Estonians | 33.3 /100 | #191 | Fair 8.8% |
| Immigrants | Kenya | 31.8 /100 | #192 | Fair 8.8% |
| Immigrants | Guyana | 29.9 /100 | #193 | Fair 8.8% |
| Maltese | 29.2 /100 | #194 | Fair 8.8% |
| Okinawans | 28.9 /100 | #195 | Fair 8.8% |
| Immigrants | Jamaica | 27.7 /100 | #196 | Fair 8.9% |
| Immigrants | Laos | 26.3 /100 | #197 | Fair 8.9% |
| Eastern Europeans | 25.9 /100 | #198 | Fair 8.9% |
| Pakistanis | 25.4 /100 | #199 | Fair 8.9% |
| Osage | 25.4 /100 | #200 | Fair 8.9% |
| Immigrants | Peru | 24.3 /100 | #201 | Fair 8.9% |
| Russians | 24.1 /100 | #202 | Fair 8.9% |
| Immigrants | Northern Europe | 23.9 /100 | #203 | Fair 8.9% |
| Spaniards | 22.0 /100 | #204 | Fair 8.9% |
Demographics Similar to Belgians by Unemployment Among Seniors over 75 years
In terms of unemployment among seniors over 75 years, the demographic groups most similar to Belgians are Iraqi (9.9%, a difference of 0.020%), Lithuanian (9.9%, a difference of 0.28%), Welsh (10.0%, a difference of 0.45%), Finnish (10.0%, a difference of 0.55%), and Puget Sound Salish (10.0%, a difference of 0.63%).
| Demographics | Rating | Rank | Unemployment Among Seniors over 75 years |
| Immigrants | Western Africa | 0.0 /100 | #292 | Tragic 9.8% |
| Norwegians | 0.0 /100 | #293 | Tragic 9.8% |
| Immigrants | Dominica | 0.0 /100 | #294 | Tragic 9.8% |
| Immigrants | Nonimmigrants | 0.0 /100 | #295 | Tragic 9.8% |
| Immigrants | St. Vincent and the Grenadines | 0.0 /100 | #296 | Tragic 9.8% |
| Cherokee | 0.0 /100 | #297 | Tragic 9.8% |
| Lithuanians | 0.0 /100 | #298 | Tragic 9.9% |
| Belgians | 0.0 /100 | #299 | Tragic 9.9% |
| Iraqis | 0.0 /100 | #300 | Tragic 9.9% |
| Welsh | 0.0 /100 | #301 | Tragic 10.0% |
| Finns | 0.0 /100 | #302 | Tragic 10.0% |
| Puget Sound Salish | 0.0 /100 | #303 | Tragic 10.0% |
| Scotch-Irish | 0.0 /100 | #304 | Tragic 10.0% |
| Swedes | 0.0 /100 | #305 | Tragic 10.0% |
| Italians | 0.0 /100 | #306 | Tragic 10.0% |