Peruvian vs Guamanian/Chamorro Unemployment Among Ages 55 to 59 years
COMPARE
Peruvian
Guamanian/Chamorro
Unemployment Among Ages 55 to 59 years
Unemployment Among Ages 55 to 59 years Comparison
Peruvians
Guamanians/Chamorros
4.8%
UNEMPLOYMENT AMONG AGES 55 TO 59 YEARS
37.0/ 100
METRIC RATING
185th/ 347
METRIC RANK
4.9%
UNEMPLOYMENT AMONG AGES 55 TO 59 YEARS
20.8/ 100
METRIC RATING
203rd/ 347
METRIC RANK
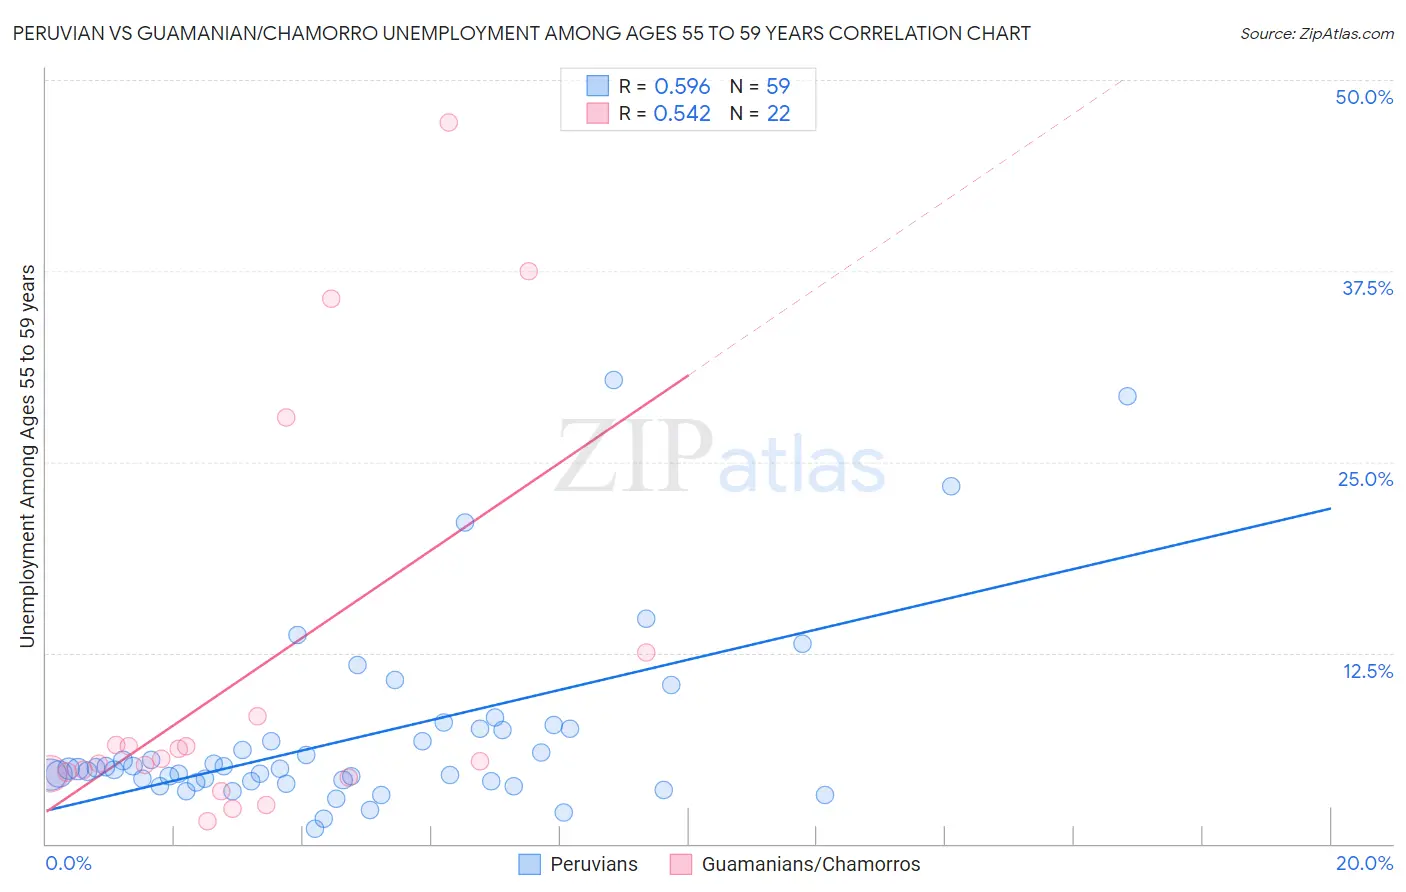
Peruvian vs Guamanian/Chamorro Unemployment Among Ages 55 to 59 years Correlation Chart
The statistical analysis conducted on geographies consisting of 343,420,423 people shows a substantial positive correlation between the proportion of Peruvians and unemployment rate among population between the ages 55 and 59 in the United States with a correlation coefficient (R) of 0.596 and weighted average of 4.8%. Similarly, the statistical analysis conducted on geographies consisting of 213,051,603 people shows a substantial positive correlation between the proportion of Guamanians/Chamorros and unemployment rate among population between the ages 55 and 59 in the United States with a correlation coefficient (R) of 0.542 and weighted average of 4.9%, a difference of 0.82%.
Unemployment Among Ages 55 to 59 years Correlation Summary
| Measurement | Peruvian | Guamanian/Chamorro |
| Minimum | 0.96% | 1.5% |
| Maximum | 30.4% | 47.3% |
| Range | 29.4% | 45.7% |
| Mean | 7.0% | 11.1% |
| Median | 4.9% | 5.5% |
| Interquartile 25% (IQ1) | 4.1% | 4.6% |
| Interquartile 75% (IQ3) | 7.5% | 8.3% |
| Interquartile Range (IQR) | 3.4% | 3.7% |
| Standard Deviation (Sample) | 6.0% | 13.1% |
| Standard Deviation (Population) | 5.9% | 12.8% |
Demographics Similar to Peruvians and Guamanians/Chamorros by Unemployment Among Ages 55 to 59 years
In terms of unemployment among ages 55 to 59 years, the demographic groups most similar to Peruvians are Osage (4.8%, a difference of 0.0%), Immigrants from Morocco (4.8%, a difference of 0.020%), Immigrants from Czechoslovakia (4.8%, a difference of 0.040%), Immigrants from Eastern Asia (4.8%, a difference of 0.040%), and Iroquois (4.9%, a difference of 0.11%). Similarly, the demographic groups most similar to Guamanians/Chamorros are Lumbee (4.9%, a difference of 0.10%), Immigrants from South America (4.9%, a difference of 0.13%), Basque (4.9%, a difference of 0.15%), Immigrants from Latvia (4.9%, a difference of 0.15%), and Immigrants from Russia (4.9%, a difference of 0.17%).
| Demographics | Rating | Rank | Unemployment Among Ages 55 to 59 years |
| Immigrants | Czechoslovakia | 38.0 /100 | #184 | Fair 4.8% |
| Peruvians | 37.0 /100 | #185 | Fair 4.8% |
| Osage | 37.0 /100 | #186 | Fair 4.8% |
| Immigrants | Morocco | 36.5 /100 | #187 | Fair 4.8% |
| Immigrants | Eastern Asia | 36.1 /100 | #188 | Fair 4.8% |
| Iroquois | 34.5 /100 | #189 | Fair 4.9% |
| Russians | 33.9 /100 | #190 | Fair 4.9% |
| Iranians | 32.4 /100 | #191 | Fair 4.9% |
| Immigrants | Ukraine | 31.7 /100 | #192 | Fair 4.9% |
| Immigrants | Italy | 30.1 /100 | #193 | Fair 4.9% |
| Spaniards | 27.2 /100 | #194 | Fair 4.9% |
| Estonians | 27.2 /100 | #195 | Fair 4.9% |
| Eastern Europeans | 26.7 /100 | #196 | Fair 4.9% |
| Macedonians | 26.4 /100 | #197 | Fair 4.9% |
| Immigrants | Philippines | 26.1 /100 | #198 | Fair 4.9% |
| Immigrants | Russia | 23.7 /100 | #199 | Fair 4.9% |
| Basques | 23.3 /100 | #200 | Fair 4.9% |
| Immigrants | South America | 23.1 /100 | #201 | Fair 4.9% |
| Lumbee | 22.5 /100 | #202 | Fair 4.9% |
| Guamanians/Chamorros | 20.8 /100 | #203 | Fair 4.9% |
| Immigrants | Latvia | 18.5 /100 | #204 | Poor 4.9% |