Bermudan vs Guamanian/Chamorro Unemployment Among Ages 55 to 59 years
COMPARE
Bermudan
Guamanian/Chamorro
Unemployment Among Ages 55 to 59 years
Unemployment Among Ages 55 to 59 years Comparison
Bermudans
Guamanians/Chamorros
4.9%
UNEMPLOYMENT AMONG AGES 55 TO 59 YEARS
11.0/ 100
METRIC RATING
213th/ 347
METRIC RANK
4.9%
UNEMPLOYMENT AMONG AGES 55 TO 59 YEARS
20.8/ 100
METRIC RATING
203rd/ 347
METRIC RANK
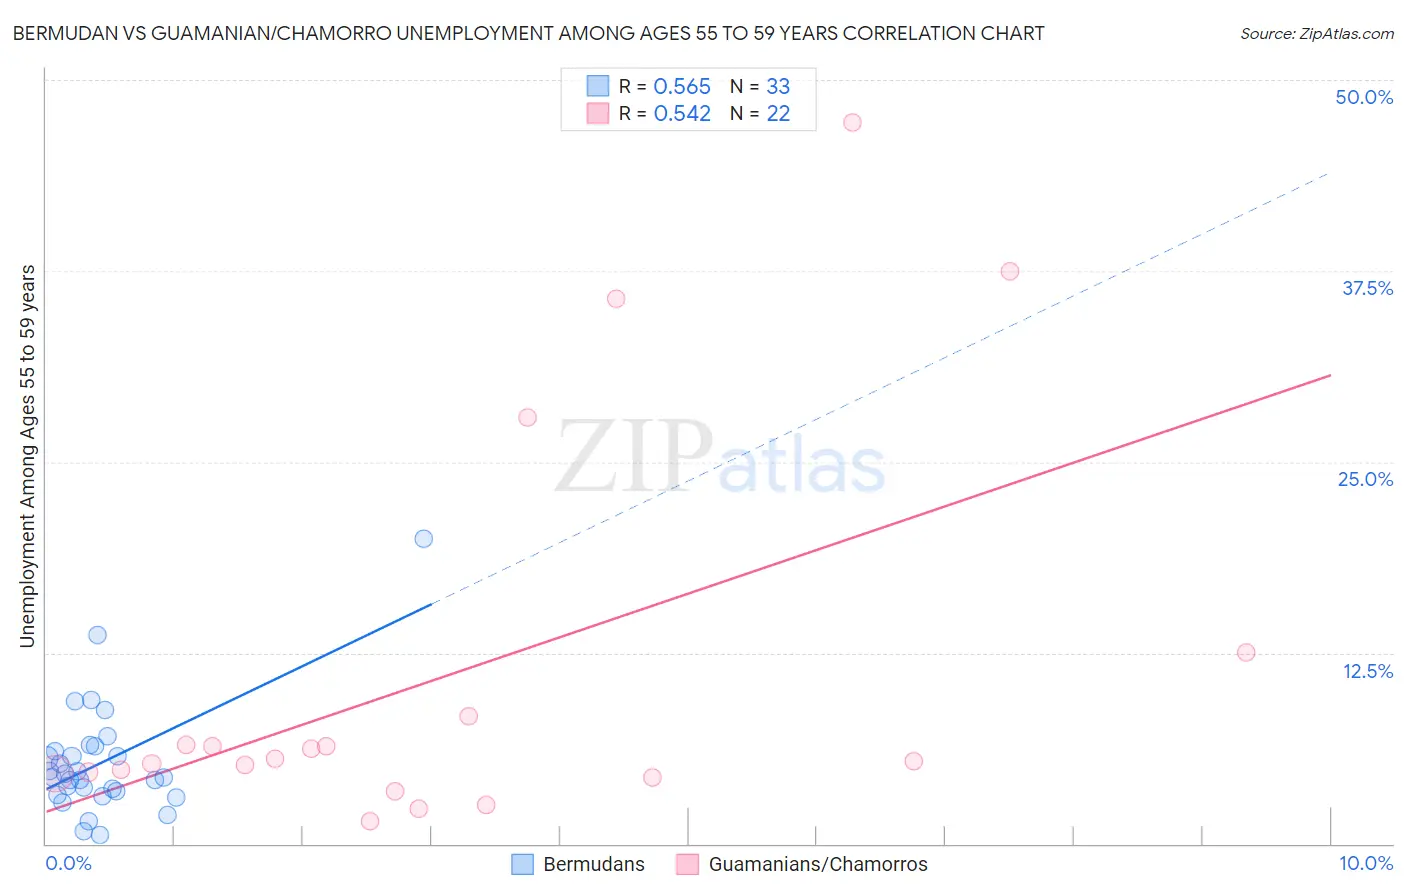
Bermudan vs Guamanian/Chamorro Unemployment Among Ages 55 to 59 years Correlation Chart
The statistical analysis conducted on geographies consisting of 54,841,432 people shows a substantial positive correlation between the proportion of Bermudans and unemployment rate among population between the ages 55 and 59 in the United States with a correlation coefficient (R) of 0.565 and weighted average of 4.9%. Similarly, the statistical analysis conducted on geographies consisting of 213,051,603 people shows a substantial positive correlation between the proportion of Guamanians/Chamorros and unemployment rate among population between the ages 55 and 59 in the United States with a correlation coefficient (R) of 0.542 and weighted average of 4.9%, a difference of 0.75%.
Unemployment Among Ages 55 to 59 years Correlation Summary
| Measurement | Bermudan | Guamanian/Chamorro |
| Minimum | 0.58% | 1.5% |
| Maximum | 20.0% | 47.3% |
| Range | 19.4% | 45.7% |
| Mean | 5.3% | 11.1% |
| Median | 4.3% | 5.5% |
| Interquartile 25% (IQ1) | 3.3% | 4.6% |
| Interquartile 75% (IQ3) | 6.2% | 8.3% |
| Interquartile Range (IQR) | 2.9% | 3.7% |
| Standard Deviation (Sample) | 3.7% | 13.1% |
| Standard Deviation (Population) | 3.7% | 12.8% |
Demographics Similar to Bermudans and Guamanians/Chamorros by Unemployment Among Ages 55 to 59 years
In terms of unemployment among ages 55 to 59 years, the demographic groups most similar to Bermudans are Nonimmigrants (4.9%, a difference of 0.020%), Immigrants from Denmark (4.9%, a difference of 0.070%), Hawaiian (4.9%, a difference of 0.17%), Creek (4.9%, a difference of 0.18%), and Immigrants from Haiti (4.9%, a difference of 0.21%). Similarly, the demographic groups most similar to Guamanians/Chamorros are Lumbee (4.9%, a difference of 0.10%), Immigrants from South America (4.9%, a difference of 0.13%), Basque (4.9%, a difference of 0.15%), Immigrants from Latvia (4.9%, a difference of 0.15%), and Immigrants from Russia (4.9%, a difference of 0.17%).
| Demographics | Rating | Rank | Unemployment Among Ages 55 to 59 years |
| Immigrants | Philippines | 26.1 /100 | #198 | Fair 4.9% |
| Immigrants | Russia | 23.7 /100 | #199 | Fair 4.9% |
| Basques | 23.3 /100 | #200 | Fair 4.9% |
| Immigrants | South America | 23.1 /100 | #201 | Fair 4.9% |
| Lumbee | 22.5 /100 | #202 | Fair 4.9% |
| Guamanians/Chamorros | 20.8 /100 | #203 | Fair 4.9% |
| Immigrants | Latvia | 18.5 /100 | #204 | Poor 4.9% |
| Haitians | 18.1 /100 | #205 | Poor 4.9% |
| Immigrants | Belarus | 14.1 /100 | #206 | Poor 4.9% |
| Immigrants | Australia | 14.1 /100 | #207 | Poor 4.9% |
| Immigrants | Kazakhstan | 14.0 /100 | #208 | Poor 4.9% |
| Immigrants | Haiti | 13.3 /100 | #209 | Poor 4.9% |
| Creek | 12.9 /100 | #210 | Poor 4.9% |
| Hawaiians | 12.8 /100 | #211 | Poor 4.9% |
| Immigrants | Nonimmigrants | 11.2 /100 | #212 | Poor 4.9% |
| Bermudans | 11.0 /100 | #213 | Poor 4.9% |
| Immigrants | Denmark | 10.3 /100 | #214 | Poor 4.9% |
| Syrians | 8.6 /100 | #215 | Tragic 4.9% |
| Spanish Americans | 8.1 /100 | #216 | Tragic 4.9% |
| Immigrants | Brazil | 8.1 /100 | #217 | Tragic 4.9% |
| Immigrants | Austria | 8.0 /100 | #218 | Tragic 4.9% |