Panamanian vs Yakama Unemployment Among Ages 35 to 44 years
COMPARE
Panamanian
Yakama
Unemployment Among Ages 35 to 44 years
Unemployment Among Ages 35 to 44 years Comparison
Panamanians
Yakama
5.0%
UNEMPLOYMENT AMONG AGES 35 TO 44 YEARS
2.9/ 100
METRIC RATING
224th/ 347
METRIC RANK
5.6%
UNEMPLOYMENT AMONG AGES 35 TO 44 YEARS
0.0/ 100
METRIC RATING
303rd/ 347
METRIC RANK
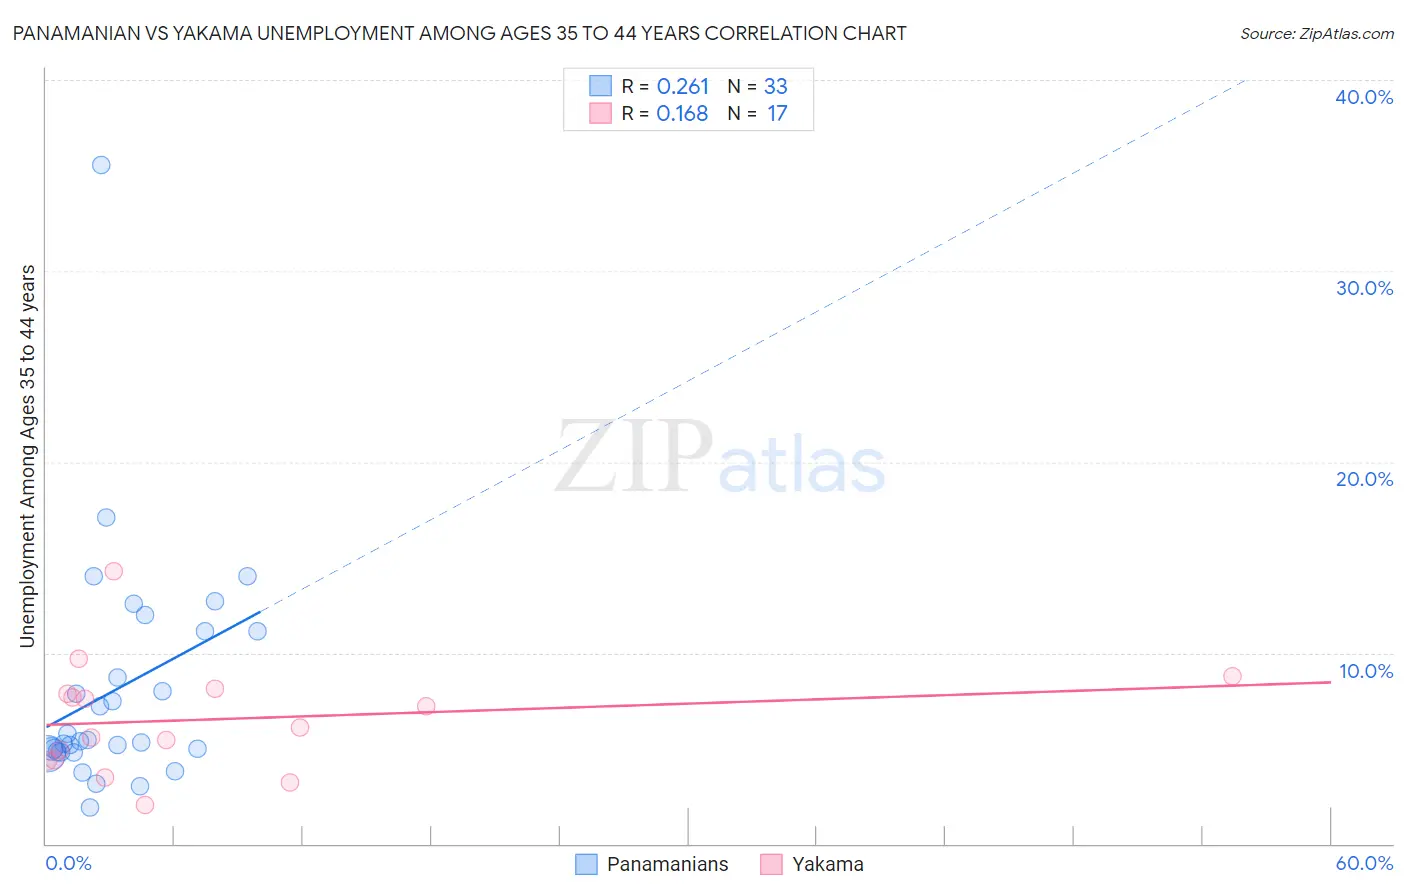
Panamanian vs Yakama Unemployment Among Ages 35 to 44 years Correlation Chart
The statistical analysis conducted on geographies consisting of 277,944,879 people shows a weak positive correlation between the proportion of Panamanians and unemployment rate among population between the ages 35 and 44 in the United States with a correlation coefficient (R) of 0.261 and weighted average of 5.0%. Similarly, the statistical analysis conducted on geographies consisting of 19,744,668 people shows a poor positive correlation between the proportion of Yakama and unemployment rate among population between the ages 35 and 44 in the United States with a correlation coefficient (R) of 0.168 and weighted average of 5.6%, a difference of 13.2%.
Unemployment Among Ages 35 to 44 years Correlation Summary
| Measurement | Panamanian | Yakama |
| Minimum | 1.9% | 2.0% |
| Maximum | 35.5% | 14.3% |
| Range | 33.6% | 12.3% |
| Mean | 8.1% | 6.5% |
| Median | 5.3% | 6.1% |
| Interquartile 25% (IQ1) | 4.8% | 4.4% |
| Interquartile 75% (IQ3) | 11.1% | 8.0% |
| Interquartile Range (IQR) | 6.3% | 3.6% |
| Standard Deviation (Sample) | 6.2% | 2.9% |
| Standard Deviation (Population) | 6.1% | 2.8% |
Similar Demographics by Unemployment Among Ages 35 to 44 years
Demographics Similar to Panamanians by Unemployment Among Ages 35 to 44 years
In terms of unemployment among ages 35 to 44 years, the demographic groups most similar to Panamanians are Immigrants from Lebanon (5.0%, a difference of 0.12%), Immigrants from Panama (5.0%, a difference of 0.23%), Potawatomi (5.0%, a difference of 0.23%), Hmong (5.0%, a difference of 0.31%), and Bermudan (5.0%, a difference of 0.50%).
| Demographics | Rating | Rank | Unemployment Among Ages 35 to 44 years |
| Moroccans | 6.0 /100 | #217 | Tragic 4.9% |
| Chickasaw | 5.7 /100 | #218 | Tragic 4.9% |
| Sierra Leoneans | 4.8 /100 | #219 | Tragic 4.9% |
| Immigrants | Sierra Leone | 4.7 /100 | #220 | Tragic 4.9% |
| Bermudans | 3.9 /100 | #221 | Tragic 5.0% |
| Hmong | 3.5 /100 | #222 | Tragic 5.0% |
| Immigrants | Panama | 3.3 /100 | #223 | Tragic 5.0% |
| Panamanians | 2.9 /100 | #224 | Tragic 5.0% |
| Immigrants | Lebanon | 2.7 /100 | #225 | Tragic 5.0% |
| Potawatomi | 2.5 /100 | #226 | Tragic 5.0% |
| Immigrants | Uzbekistan | 1.9 /100 | #227 | Tragic 5.0% |
| Samoans | 1.8 /100 | #228 | Tragic 5.0% |
| Immigrants | Cambodia | 1.5 /100 | #229 | Tragic 5.0% |
| Liberians | 1.3 /100 | #230 | Tragic 5.1% |
| Japanese | 1.2 /100 | #231 | Tragic 5.1% |
Demographics Similar to Yakama by Unemployment Among Ages 35 to 44 years
In terms of unemployment among ages 35 to 44 years, the demographic groups most similar to Yakama are West Indian (5.7%, a difference of 0.26%), Belizean (5.7%, a difference of 0.40%), Nepalese (5.6%, a difference of 0.72%), African (5.6%, a difference of 0.85%), and Immigrants from West Indies (5.6%, a difference of 0.89%).
| Demographics | Rating | Rank | Unemployment Among Ages 35 to 44 years |
| Immigrants | Trinidad and Tobago | 0.0 /100 | #296 | Tragic 5.6% |
| U.S. Virgin Islanders | 0.0 /100 | #297 | Tragic 5.6% |
| Aleuts | 0.0 /100 | #298 | Tragic 5.6% |
| Immigrants | Jamaica | 0.0 /100 | #299 | Tragic 5.6% |
| Immigrants | West Indies | 0.0 /100 | #300 | Tragic 5.6% |
| Africans | 0.0 /100 | #301 | Tragic 5.6% |
| Nepalese | 0.0 /100 | #302 | Tragic 5.6% |
| Yakama | 0.0 /100 | #303 | Tragic 5.6% |
| West Indians | 0.0 /100 | #304 | Tragic 5.7% |
| Belizeans | 0.0 /100 | #305 | Tragic 5.7% |
| Barbadians | 0.0 /100 | #306 | Tragic 5.7% |
| Immigrants | Belize | 0.0 /100 | #307 | Tragic 5.8% |
| Immigrants | Azores | 0.0 /100 | #308 | Tragic 5.8% |
| Immigrants | Barbados | 0.0 /100 | #309 | Tragic 5.8% |
| Guyanese | 0.0 /100 | #310 | Tragic 5.9% |