Immigrants from Ecuador vs Yakama Unemployment Among Ages 35 to 44 years
COMPARE
Immigrants from Ecuador
Yakama
Unemployment Among Ages 35 to 44 years
Unemployment Among Ages 35 to 44 years Comparison
Immigrants from Ecuador
Yakama
5.4%
UNEMPLOYMENT AMONG AGES 35 TO 44 YEARS
0.0/ 100
METRIC RATING
283rd/ 347
METRIC RANK
5.6%
UNEMPLOYMENT AMONG AGES 35 TO 44 YEARS
0.0/ 100
METRIC RATING
303rd/ 347
METRIC RANK
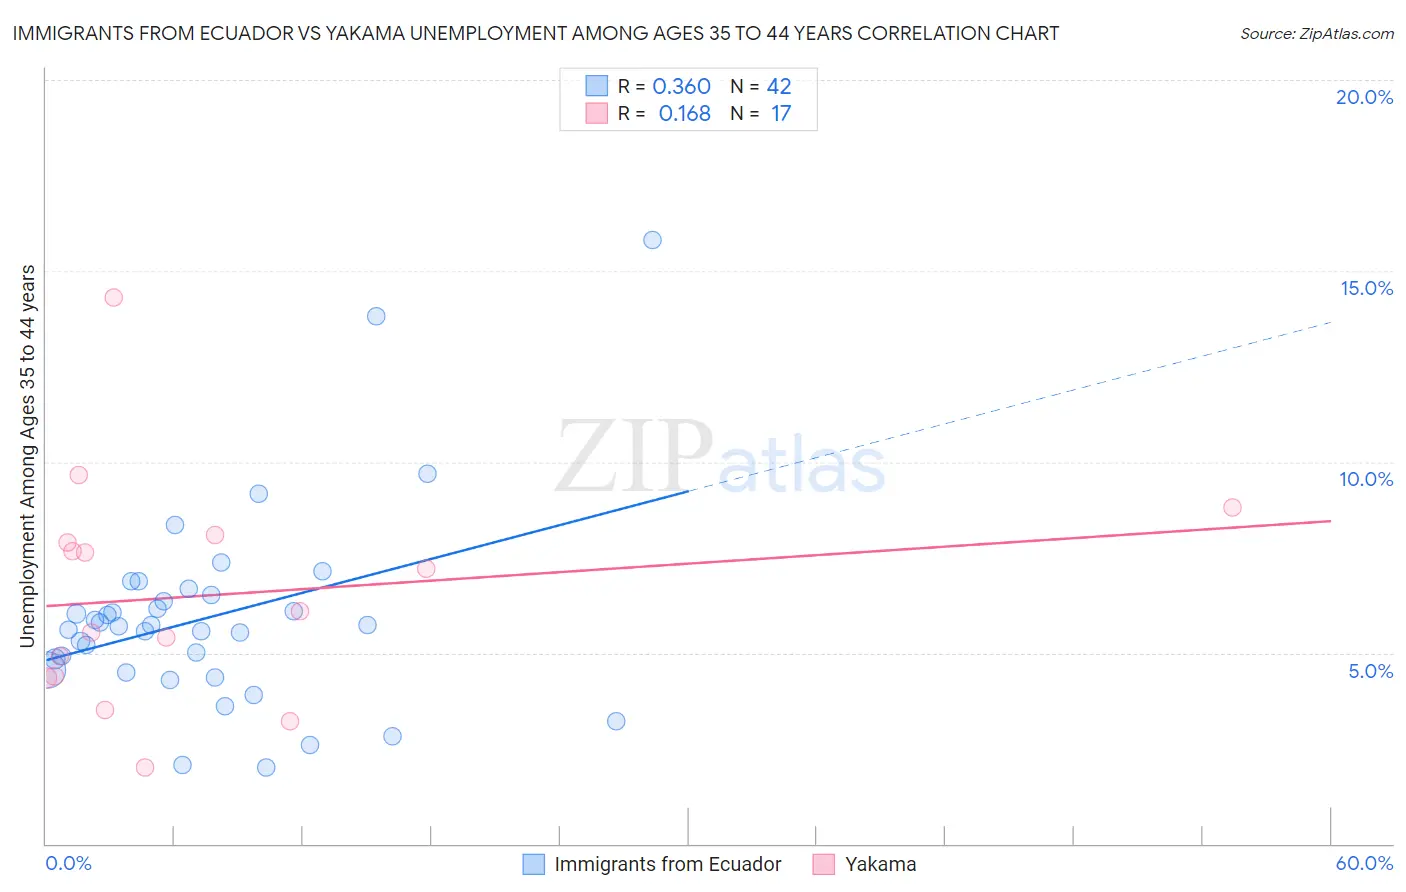
Immigrants from Ecuador vs Yakama Unemployment Among Ages 35 to 44 years Correlation Chart
The statistical analysis conducted on geographies consisting of 267,738,021 people shows a mild positive correlation between the proportion of Immigrants from Ecuador and unemployment rate among population between the ages 35 and 44 in the United States with a correlation coefficient (R) of 0.360 and weighted average of 5.4%. Similarly, the statistical analysis conducted on geographies consisting of 19,744,668 people shows a poor positive correlation between the proportion of Yakama and unemployment rate among population between the ages 35 and 44 in the United States with a correlation coefficient (R) of 0.168 and weighted average of 5.6%, a difference of 3.5%.
Unemployment Among Ages 35 to 44 years Correlation Summary
| Measurement | Immigrants from Ecuador | Yakama |
| Minimum | 2.0% | 2.0% |
| Maximum | 15.8% | 14.3% |
| Range | 13.8% | 12.3% |
| Mean | 5.9% | 6.5% |
| Median | 5.7% | 6.1% |
| Interquartile 25% (IQ1) | 4.6% | 4.4% |
| Interquartile 75% (IQ3) | 6.5% | 8.0% |
| Interquartile Range (IQR) | 1.9% | 3.6% |
| Standard Deviation (Sample) | 2.6% | 2.9% |
| Standard Deviation (Population) | 2.6% | 2.8% |
Demographics Similar to Immigrants from Ecuador and Yakama by Unemployment Among Ages 35 to 44 years
In terms of unemployment among ages 35 to 44 years, the demographic groups most similar to Immigrants from Ecuador are Haitian (5.5%, a difference of 0.54%), Hispanic or Latino (5.5%, a difference of 0.70%), Immigrants from Micronesia (5.5%, a difference of 0.82%), French American Indian (5.5%, a difference of 0.94%), and Cree (5.5%, a difference of 1.1%). Similarly, the demographic groups most similar to Yakama are Nepalese (5.6%, a difference of 0.72%), African (5.6%, a difference of 0.85%), Immigrants from West Indies (5.6%, a difference of 0.89%), Immigrants from Jamaica (5.6%, a difference of 0.94%), and Aleut (5.6%, a difference of 1.0%).
| Demographics | Rating | Rank | Unemployment Among Ages 35 to 44 years |
| Immigrants | Ecuador | 0.0 /100 | #283 | Tragic 5.4% |
| Haitians | 0.0 /100 | #284 | Tragic 5.5% |
| Hispanics or Latinos | 0.0 /100 | #285 | Tragic 5.5% |
| Immigrants | Micronesia | 0.0 /100 | #286 | Tragic 5.5% |
| French American Indians | 0.0 /100 | #287 | Tragic 5.5% |
| Cree | 0.0 /100 | #288 | Tragic 5.5% |
| Spanish American Indians | 0.0 /100 | #289 | Tragic 5.5% |
| Jamaicans | 0.0 /100 | #290 | Tragic 5.5% |
| Dutch West Indians | 0.0 /100 | #291 | Tragic 5.5% |
| Immigrants | Haiti | 0.0 /100 | #292 | Tragic 5.5% |
| Central American Indians | 0.0 /100 | #293 | Tragic 5.6% |
| Trinidadians and Tobagonians | 0.0 /100 | #294 | Tragic 5.6% |
| Ottawa | 0.0 /100 | #295 | Tragic 5.6% |
| Immigrants | Trinidad and Tobago | 0.0 /100 | #296 | Tragic 5.6% |
| U.S. Virgin Islanders | 0.0 /100 | #297 | Tragic 5.6% |
| Aleuts | 0.0 /100 | #298 | Tragic 5.6% |
| Immigrants | Jamaica | 0.0 /100 | #299 | Tragic 5.6% |
| Immigrants | West Indies | 0.0 /100 | #300 | Tragic 5.6% |
| Africans | 0.0 /100 | #301 | Tragic 5.6% |
| Nepalese | 0.0 /100 | #302 | Tragic 5.6% |
| Yakama | 0.0 /100 | #303 | Tragic 5.6% |