Pakistani vs Greek Unemployment Among Seniors over 65 years
COMPARE
Pakistani
Greek
Unemployment Among Seniors over 65 years
Unemployment Among Seniors over 65 years Comparison
Pakistanis
Greeks
5.1%
UNEMPLOYMENT AMONG SENIORS OVER 65 YEARS
75.5/ 100
METRIC RATING
151st/ 347
METRIC RANK
5.1%
UNEMPLOYMENT AMONG SENIORS OVER 65 YEARS
77.0/ 100
METRIC RATING
148th/ 347
METRIC RANK
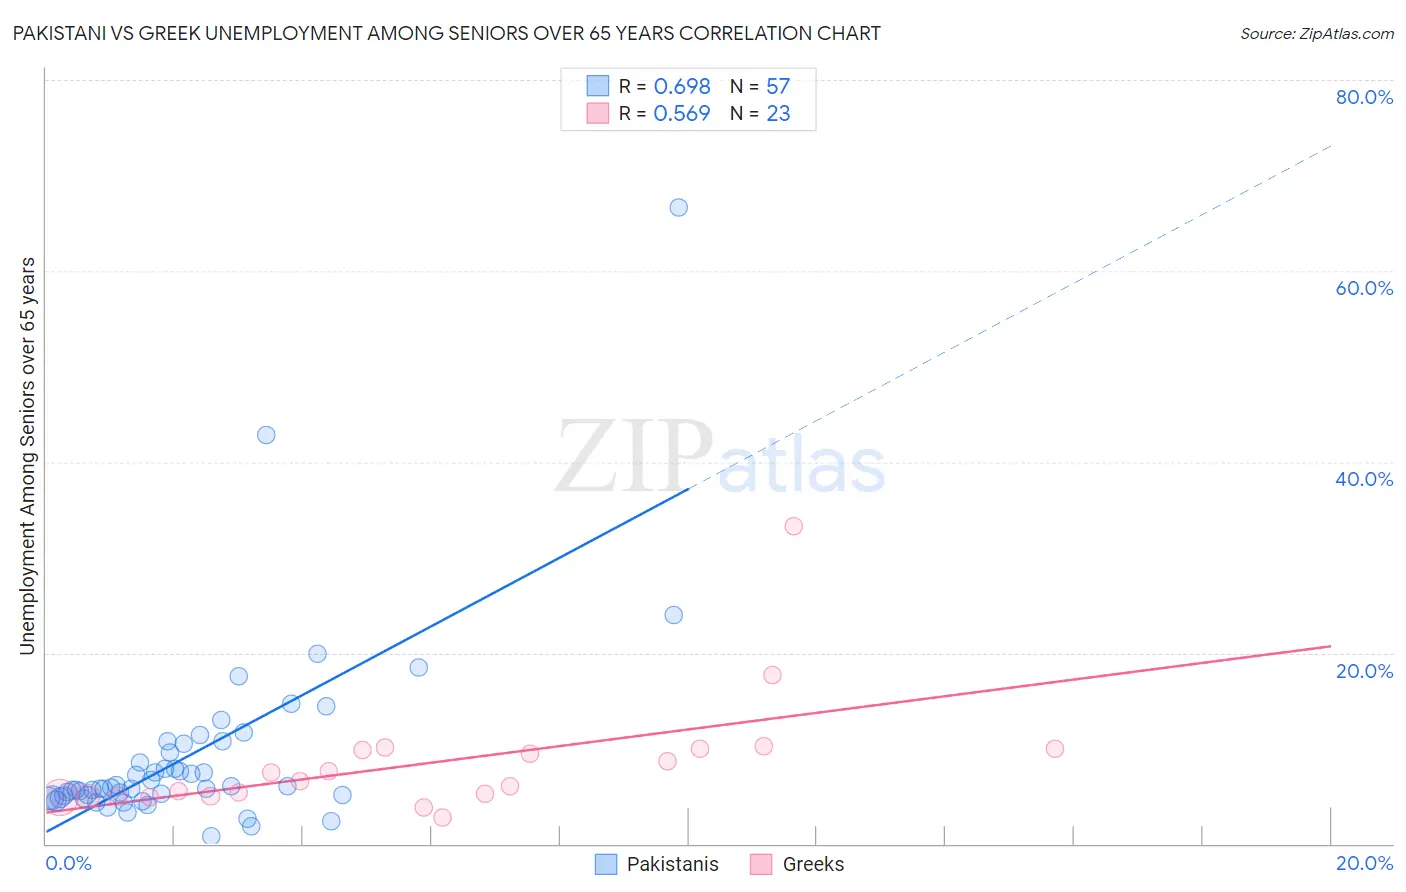
Pakistani vs Greek Unemployment Among Seniors over 65 years Correlation Chart
The statistical analysis conducted on geographies consisting of 309,020,575 people shows a significant positive correlation between the proportion of Pakistanis and unemployment rate amomg seniors over the age of 65 in the United States with a correlation coefficient (R) of 0.698 and weighted average of 5.1%. Similarly, the statistical analysis conducted on geographies consisting of 418,448,484 people shows a substantial positive correlation between the proportion of Greeks and unemployment rate amomg seniors over the age of 65 in the United States with a correlation coefficient (R) of 0.569 and weighted average of 5.1%, a difference of 0.070%.
Unemployment Among Seniors over 65 years Correlation Summary
| Measurement | Pakistani | Greek |
| Minimum | 0.80% | 2.7% |
| Maximum | 66.6% | 33.3% |
| Range | 65.8% | 30.6% |
| Mean | 9.1% | 8.4% |
| Median | 5.8% | 6.5% |
| Interquartile 25% (IQ1) | 4.8% | 5.0% |
| Interquartile 75% (IQ3) | 10.0% | 9.9% |
| Interquartile Range (IQR) | 5.2% | 4.9% |
| Standard Deviation (Sample) | 10.1% | 6.3% |
| Standard Deviation (Population) | 10.0% | 6.2% |
Demographics Similar to Pakistanis and Greeks by Unemployment Among Seniors over 65 years
In terms of unemployment among seniors over 65 years, the demographic groups most similar to Pakistanis are Immigrants from Asia (5.1%, a difference of 0.0%), Canadian (5.1%, a difference of 0.030%), Immigrants from Czechoslovakia (5.1%, a difference of 0.040%), Immigrants from Afghanistan (5.1%, a difference of 0.060%), and Immigrants from Hong Kong (5.1%, a difference of 0.060%). Similarly, the demographic groups most similar to Greeks are Immigrants from Afghanistan (5.1%, a difference of 0.010%), Slovak (5.1%, a difference of 0.040%), Immigrants from Asia (5.1%, a difference of 0.060%), Immigrants from Russia (5.1%, a difference of 0.070%), and Spanish (5.1%, a difference of 0.090%).
| Demographics | Rating | Rank | Unemployment Among Seniors over 65 years |
| Immigrants | Panama | 83.0 /100 | #139 | Excellent 5.1% |
| Immigrants | Chile | 83.0 /100 | #140 | Excellent 5.1% |
| Cherokee | 81.6 /100 | #141 | Excellent 5.1% |
| Immigrants | Indonesia | 81.0 /100 | #142 | Excellent 5.1% |
| Senegalese | 80.4 /100 | #143 | Excellent 5.1% |
| Poles | 80.3 /100 | #144 | Excellent 5.1% |
| Spanish | 78.8 /100 | #145 | Good 5.1% |
| Immigrants | Russia | 78.5 /100 | #146 | Good 5.1% |
| Slovaks | 77.9 /100 | #147 | Good 5.1% |
| Greeks | 77.0 /100 | #148 | Good 5.1% |
| Immigrants | Afghanistan | 76.8 /100 | #149 | Good 5.1% |
| Immigrants | Asia | 75.6 /100 | #150 | Good 5.1% |
| Pakistanis | 75.5 /100 | #151 | Good 5.1% |
| Canadians | 74.7 /100 | #152 | Good 5.1% |
| Immigrants | Czechoslovakia | 74.5 /100 | #153 | Good 5.1% |
| Immigrants | Hong Kong | 74.0 /100 | #154 | Good 5.1% |
| Basques | 72.9 /100 | #155 | Good 5.1% |
| Immigrants | Romania | 72.4 /100 | #156 | Good 5.1% |
| Immigrants | Northern Europe | 69.8 /100 | #157 | Good 5.1% |
| Immigrants | Belarus | 69.0 /100 | #158 | Good 5.1% |
| Immigrants | France | 68.6 /100 | #159 | Good 5.1% |