Ghanaian vs Greek Unemployment Among Seniors over 65 years
COMPARE
Ghanaian
Greek
Unemployment Among Seniors over 65 years
Unemployment Among Seniors over 65 years Comparison
Ghanaians
Greeks
5.4%
UNEMPLOYMENT AMONG SENIORS OVER 65 YEARS
0.6/ 100
METRIC RATING
250th/ 347
METRIC RANK
5.1%
UNEMPLOYMENT AMONG SENIORS OVER 65 YEARS
77.0/ 100
METRIC RATING
148th/ 347
METRIC RANK
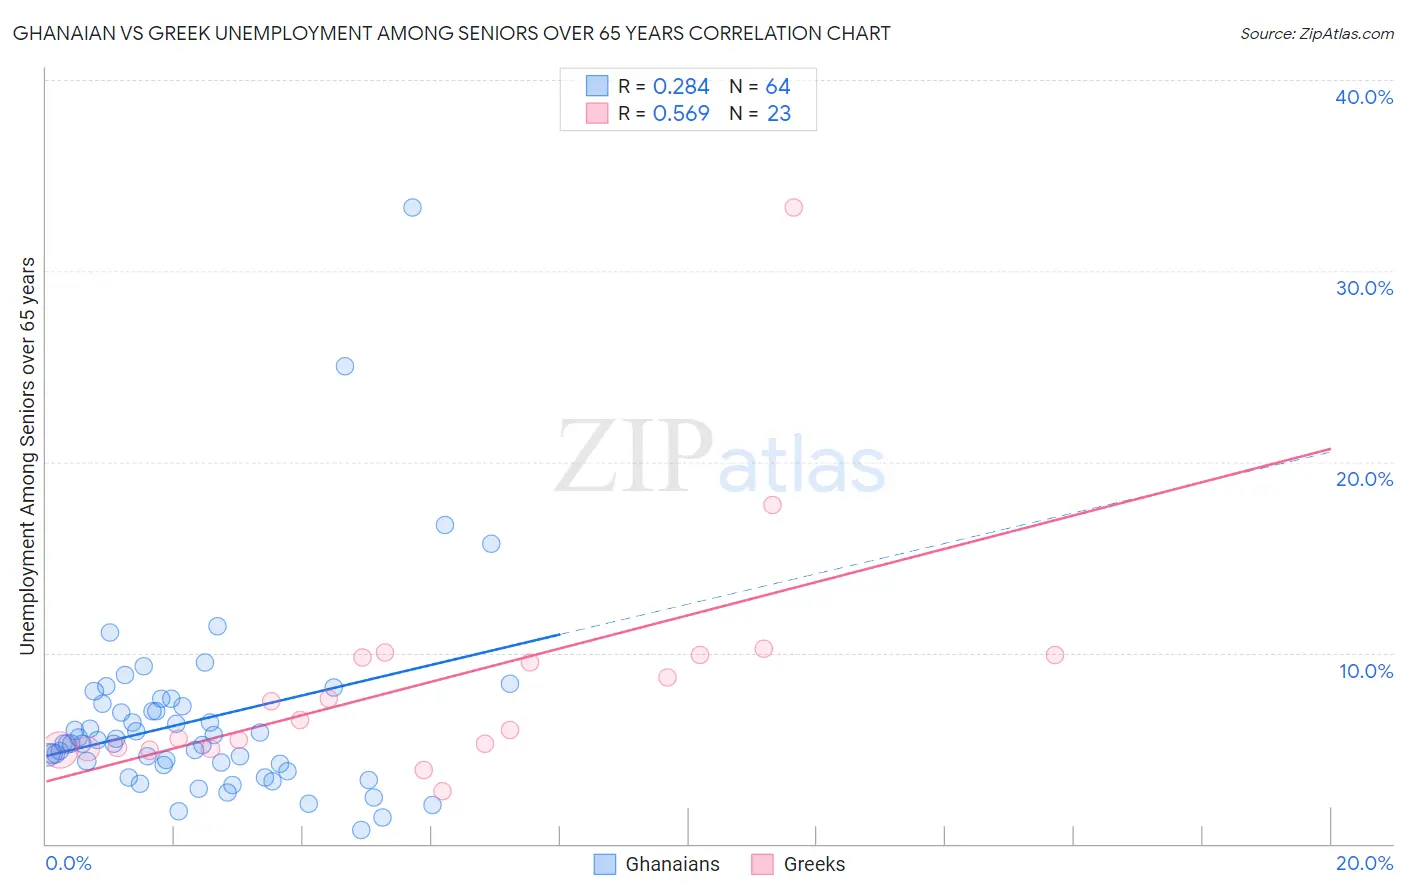
Ghanaian vs Greek Unemployment Among Seniors over 65 years Correlation Chart
The statistical analysis conducted on geographies consisting of 181,103,257 people shows a weak positive correlation between the proportion of Ghanaians and unemployment rate amomg seniors over the age of 65 in the United States with a correlation coefficient (R) of 0.284 and weighted average of 5.4%. Similarly, the statistical analysis conducted on geographies consisting of 418,448,484 people shows a substantial positive correlation between the proportion of Greeks and unemployment rate amomg seniors over the age of 65 in the United States with a correlation coefficient (R) of 0.569 and weighted average of 5.1%, a difference of 5.1%.
Unemployment Among Seniors over 65 years Correlation Summary
| Measurement | Ghanaian | Greek |
| Minimum | 0.70% | 2.7% |
| Maximum | 33.3% | 33.3% |
| Range | 32.6% | 30.6% |
| Mean | 6.5% | 8.4% |
| Median | 5.2% | 6.5% |
| Interquartile 25% (IQ1) | 4.2% | 5.0% |
| Interquartile 75% (IQ3) | 7.3% | 9.9% |
| Interquartile Range (IQR) | 3.1% | 4.9% |
| Standard Deviation (Sample) | 5.1% | 6.3% |
| Standard Deviation (Population) | 5.0% | 6.2% |
Similar Demographics by Unemployment Among Seniors over 65 years
Demographics Similar to Ghanaians by Unemployment Among Seniors over 65 years
In terms of unemployment among seniors over 65 years, the demographic groups most similar to Ghanaians are Immigrants (5.4%, a difference of 0.0%), West Indian (5.4%, a difference of 0.010%), French Canadian (5.4%, a difference of 0.030%), Immigrants from Caribbean (5.3%, a difference of 0.080%), and Trinidadian and Tobagonian (5.4%, a difference of 0.080%).
| Demographics | Rating | Rank | Unemployment Among Seniors over 65 years |
| Nigerians | 0.9 /100 | #243 | Tragic 5.3% |
| Peruvians | 0.8 /100 | #244 | Tragic 5.3% |
| Ottawa | 0.8 /100 | #245 | Tragic 5.3% |
| Colombians | 0.7 /100 | #246 | Tragic 5.3% |
| Immigrants | Caribbean | 0.7 /100 | #247 | Tragic 5.3% |
| French Canadians | 0.7 /100 | #248 | Tragic 5.4% |
| Immigrants | Immigrants | 0.6 /100 | #249 | Tragic 5.4% |
| Ghanaians | 0.6 /100 | #250 | Tragic 5.4% |
| West Indians | 0.6 /100 | #251 | Tragic 5.4% |
| Trinidadians and Tobagonians | 0.6 /100 | #252 | Tragic 5.4% |
| Immigrants | Sierra Leone | 0.6 /100 | #253 | Tragic 5.4% |
| Paraguayans | 0.5 /100 | #254 | Tragic 5.4% |
| Immigrants | Peru | 0.5 /100 | #255 | Tragic 5.4% |
| Moroccans | 0.5 /100 | #256 | Tragic 5.4% |
| Immigrants | Micronesia | 0.4 /100 | #257 | Tragic 5.4% |
Demographics Similar to Greeks by Unemployment Among Seniors over 65 years
In terms of unemployment among seniors over 65 years, the demographic groups most similar to Greeks are Immigrants from Afghanistan (5.1%, a difference of 0.010%), Slovak (5.1%, a difference of 0.040%), Immigrants from Asia (5.1%, a difference of 0.060%), Immigrants from Russia (5.1%, a difference of 0.070%), and Pakistani (5.1%, a difference of 0.070%).
| Demographics | Rating | Rank | Unemployment Among Seniors over 65 years |
| Cherokee | 81.6 /100 | #141 | Excellent 5.1% |
| Immigrants | Indonesia | 81.0 /100 | #142 | Excellent 5.1% |
| Senegalese | 80.4 /100 | #143 | Excellent 5.1% |
| Poles | 80.3 /100 | #144 | Excellent 5.1% |
| Spanish | 78.8 /100 | #145 | Good 5.1% |
| Immigrants | Russia | 78.5 /100 | #146 | Good 5.1% |
| Slovaks | 77.9 /100 | #147 | Good 5.1% |
| Greeks | 77.0 /100 | #148 | Good 5.1% |
| Immigrants | Afghanistan | 76.8 /100 | #149 | Good 5.1% |
| Immigrants | Asia | 75.6 /100 | #150 | Good 5.1% |
| Pakistanis | 75.5 /100 | #151 | Good 5.1% |
| Canadians | 74.7 /100 | #152 | Good 5.1% |
| Immigrants | Czechoslovakia | 74.5 /100 | #153 | Good 5.1% |
| Immigrants | Hong Kong | 74.0 /100 | #154 | Good 5.1% |
| Basques | 72.9 /100 | #155 | Good 5.1% |