Okinawan vs Immigrants from Cameroon Unemployment Among Ages 35 to 44 years
COMPARE
Okinawan
Immigrants from Cameroon
Unemployment Among Ages 35 to 44 years
Unemployment Among Ages 35 to 44 years Comparison
Okinawans
Immigrants from Cameroon
4.4%
UNEMPLOYMENT AMONG AGES 35 TO 44 YEARS
97.7/ 100
METRIC RATING
52nd/ 347
METRIC RANK
4.9%
UNEMPLOYMENT AMONG AGES 35 TO 44 YEARS
11.4/ 100
METRIC RATING
210th/ 347
METRIC RANK
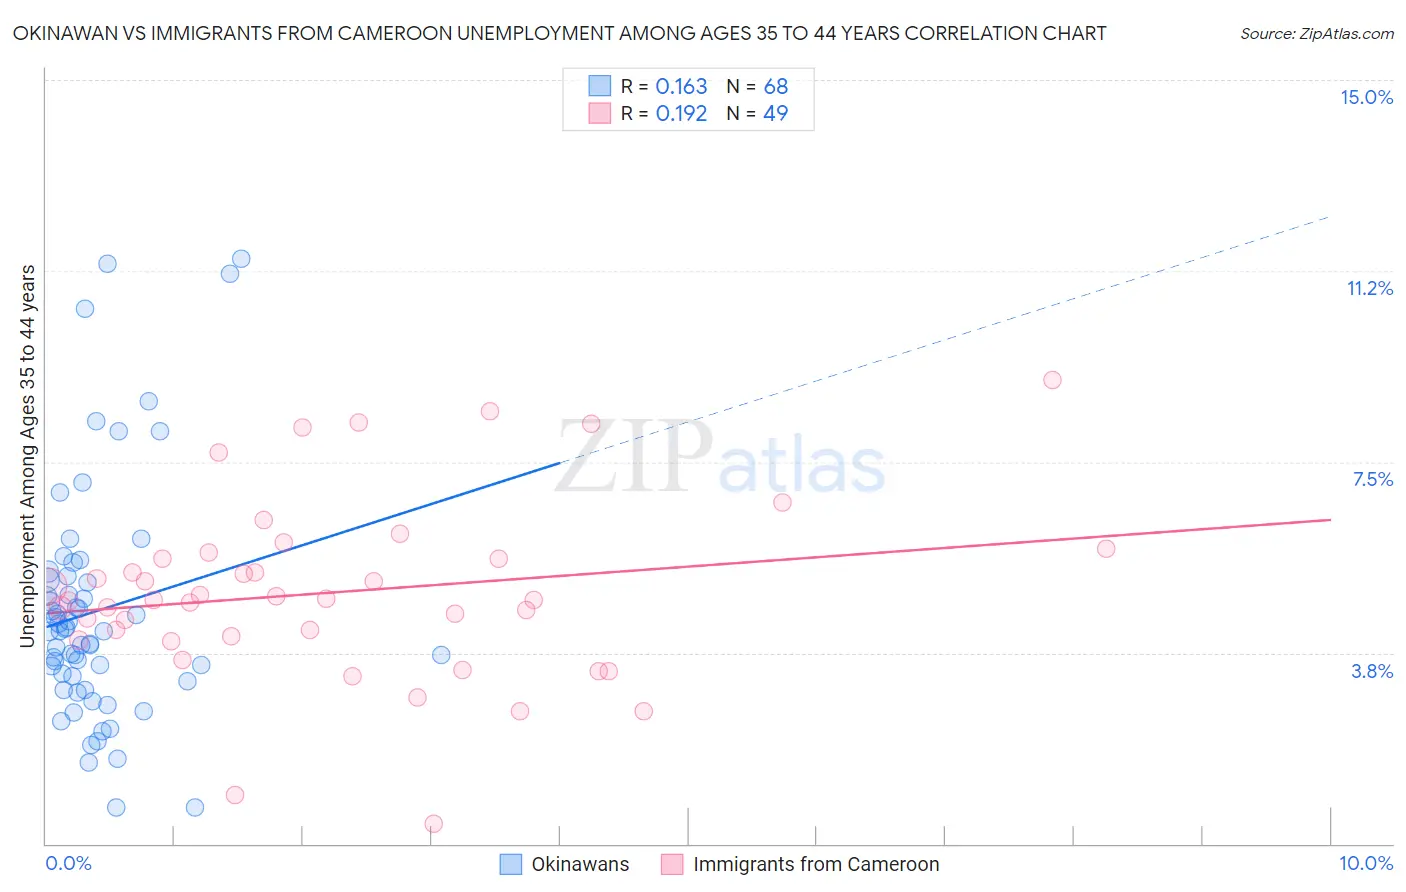
Okinawan vs Immigrants from Cameroon Unemployment Among Ages 35 to 44 years Correlation Chart
The statistical analysis conducted on geographies consisting of 73,536,762 people shows a poor positive correlation between the proportion of Okinawans and unemployment rate among population between the ages 35 and 44 in the United States with a correlation coefficient (R) of 0.163 and weighted average of 4.4%. Similarly, the statistical analysis conducted on geographies consisting of 130,008,762 people shows a poor positive correlation between the proportion of Immigrants from Cameroon and unemployment rate among population between the ages 35 and 44 in the United States with a correlation coefficient (R) of 0.192 and weighted average of 4.9%, a difference of 11.0%.
Unemployment Among Ages 35 to 44 years Correlation Summary
| Measurement | Okinawan | Immigrants from Cameroon |
| Minimum | 0.70% | 0.40% |
| Maximum | 11.5% | 9.1% |
| Range | 10.8% | 8.7% |
| Mean | 4.6% | 4.9% |
| Median | 4.2% | 4.8% |
| Interquartile 25% (IQ1) | 3.3% | 4.0% |
| Interquartile 75% (IQ3) | 5.2% | 5.7% |
| Interquartile Range (IQR) | 2.0% | 1.6% |
| Standard Deviation (Sample) | 2.3% | 1.8% |
| Standard Deviation (Population) | 2.3% | 1.7% |
Similar Demographics by Unemployment Among Ages 35 to 44 years
Demographics Similar to Okinawans by Unemployment Among Ages 35 to 44 years
In terms of unemployment among ages 35 to 44 years, the demographic groups most similar to Okinawans are Immigrants from Eastern Asia (4.4%, a difference of 0.020%), Immigrants from Turkey (4.4%, a difference of 0.040%), Immigrants from Argentina (4.4%, a difference of 0.14%), Asian (4.4%, a difference of 0.30%), and Immigrants from Moldova (4.4%, a difference of 0.33%).
| Demographics | Rating | Rank | Unemployment Among Ages 35 to 44 years |
| Immigrants | Korea | 98.4 /100 | #45 | Exceptional 4.3% |
| Immigrants | Belgium | 98.4 /100 | #46 | Exceptional 4.3% |
| British | 98.3 /100 | #47 | Exceptional 4.4% |
| Bhutanese | 98.2 /100 | #48 | Exceptional 4.4% |
| Swiss | 98.2 /100 | #49 | Exceptional 4.4% |
| Immigrants | Turkey | 97.8 /100 | #50 | Exceptional 4.4% |
| Immigrants | Eastern Asia | 97.8 /100 | #51 | Exceptional 4.4% |
| Okinawans | 97.7 /100 | #52 | Exceptional 4.4% |
| Immigrants | Argentina | 97.6 /100 | #53 | Exceptional 4.4% |
| Asians | 97.4 /100 | #54 | Exceptional 4.4% |
| Immigrants | Moldova | 97.3 /100 | #55 | Exceptional 4.4% |
| Chileans | 97.3 /100 | #56 | Exceptional 4.4% |
| Immigrants | Hong Kong | 97.2 /100 | #57 | Exceptional 4.4% |
| English | 97.2 /100 | #58 | Exceptional 4.4% |
| Greeks | 97.1 /100 | #59 | Exceptional 4.4% |
Demographics Similar to Immigrants from Cameroon by Unemployment Among Ages 35 to 44 years
In terms of unemployment among ages 35 to 44 years, the demographic groups most similar to Immigrants from Cameroon are Immigrants from Uruguay (4.9%, a difference of 0.020%), Nonimmigrants (4.9%, a difference of 0.36%), Fijian (4.9%, a difference of 0.52%), Osage (4.9%, a difference of 0.53%), and Immigrants from Africa (4.9%, a difference of 0.62%).
| Demographics | Rating | Rank | Unemployment Among Ages 35 to 44 years |
| Uruguayans | 20.0 /100 | #203 | Fair 4.8% |
| Immigrants | Philippines | 19.8 /100 | #204 | Poor 4.8% |
| Spaniards | 18.7 /100 | #205 | Poor 4.8% |
| Soviet Union | 18.4 /100 | #206 | Poor 4.8% |
| Immigrants | Western Asia | 16.6 /100 | #207 | Poor 4.8% |
| French Canadians | 16.5 /100 | #208 | Poor 4.8% |
| Immigrants | Uruguay | 11.5 /100 | #209 | Poor 4.9% |
| Immigrants | Cameroon | 11.4 /100 | #210 | Poor 4.9% |
| Immigrants | Nonimmigrants | 9.4 /100 | #211 | Tragic 4.9% |
| Fijians | 8.7 /100 | #212 | Tragic 4.9% |
| Osage | 8.6 /100 | #213 | Tragic 4.9% |
| Immigrants | Africa | 8.2 /100 | #214 | Tragic 4.9% |
| Immigrants | Immigrants | 8.0 /100 | #215 | Tragic 4.9% |
| Americans | 6.2 /100 | #216 | Tragic 4.9% |
| Moroccans | 6.0 /100 | #217 | Tragic 4.9% |