Okinawan vs European Unemployment Among Ages 35 to 44 years
COMPARE
Okinawan
European
Unemployment Among Ages 35 to 44 years
Unemployment Among Ages 35 to 44 years Comparison
Okinawans
Europeans
4.4%
UNEMPLOYMENT AMONG AGES 35 TO 44 YEARS
97.7/ 100
METRIC RATING
52nd/ 347
METRIC RANK
4.3%
UNEMPLOYMENT AMONG AGES 35 TO 44 YEARS
99.2/ 100
METRIC RATING
29th/ 347
METRIC RANK
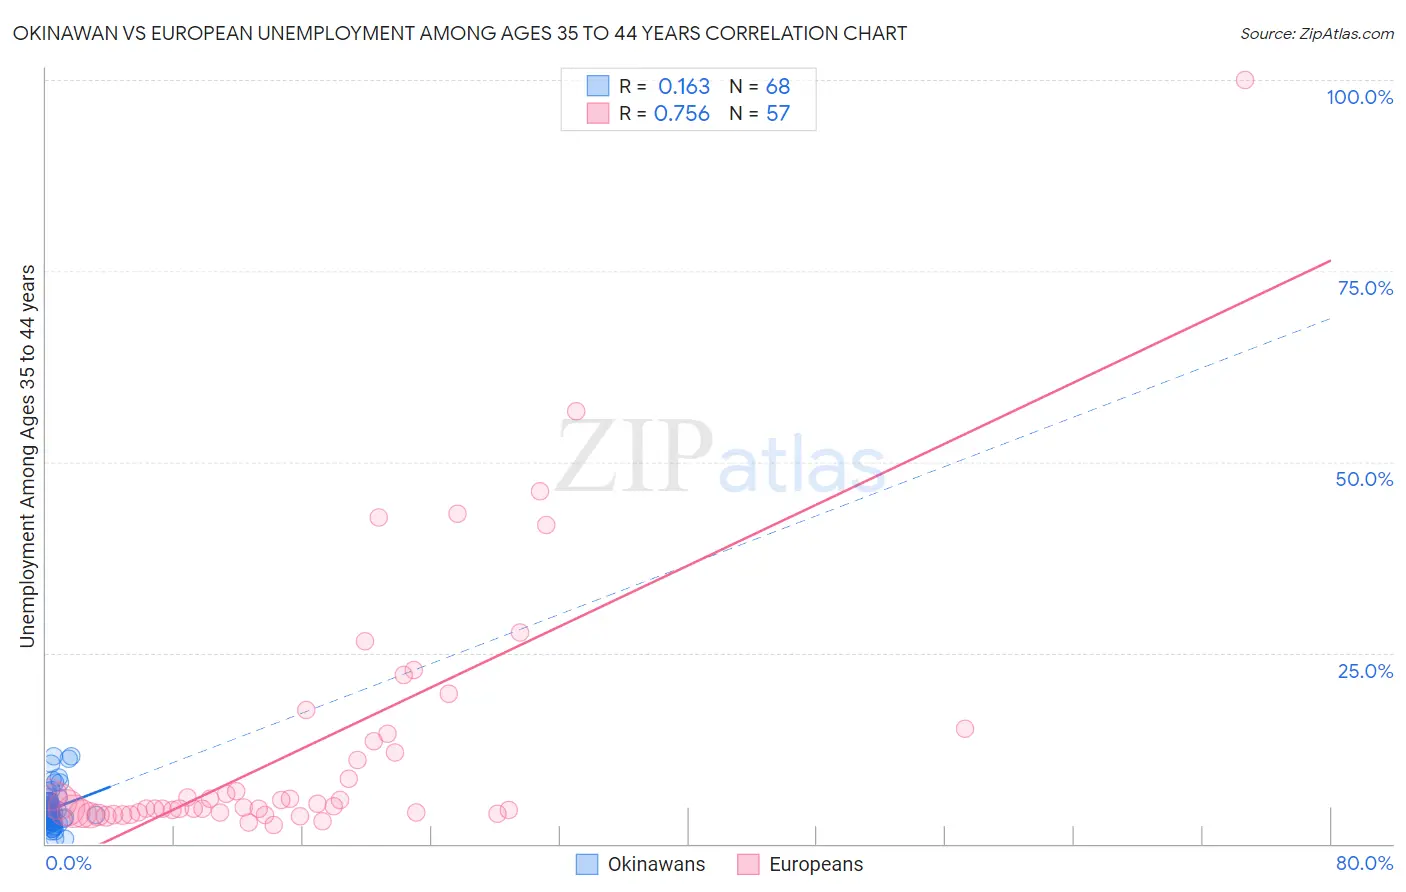
Okinawan vs European Unemployment Among Ages 35 to 44 years Correlation Chart
The statistical analysis conducted on geographies consisting of 73,536,762 people shows a poor positive correlation between the proportion of Okinawans and unemployment rate among population between the ages 35 and 44 in the United States with a correlation coefficient (R) of 0.163 and weighted average of 4.4%. Similarly, the statistical analysis conducted on geographies consisting of 525,768,798 people shows a strong positive correlation between the proportion of Europeans and unemployment rate among population between the ages 35 and 44 in the United States with a correlation coefficient (R) of 0.756 and weighted average of 4.3%, a difference of 2.1%.
Unemployment Among Ages 35 to 44 years Correlation Summary
| Measurement | Okinawan | European |
| Minimum | 0.70% | 2.4% |
| Maximum | 11.5% | 100.0% |
| Range | 10.8% | 97.6% |
| Mean | 4.6% | 12.6% |
| Median | 4.2% | 4.9% |
| Interquartile 25% (IQ1) | 3.3% | 4.1% |
| Interquartile 75% (IQ3) | 5.2% | 14.0% |
| Interquartile Range (IQR) | 2.0% | 9.9% |
| Standard Deviation (Sample) | 2.3% | 17.3% |
| Standard Deviation (Population) | 2.3% | 17.1% |
Similar Demographics by Unemployment Among Ages 35 to 44 years
Demographics Similar to Okinawans by Unemployment Among Ages 35 to 44 years
In terms of unemployment among ages 35 to 44 years, the demographic groups most similar to Okinawans are Immigrants from Eastern Asia (4.4%, a difference of 0.020%), Immigrants from Turkey (4.4%, a difference of 0.040%), Immigrants from Argentina (4.4%, a difference of 0.14%), Asian (4.4%, a difference of 0.30%), and Immigrants from Moldova (4.4%, a difference of 0.33%).
| Demographics | Rating | Rank | Unemployment Among Ages 35 to 44 years |
| Immigrants | Korea | 98.4 /100 | #45 | Exceptional 4.3% |
| Immigrants | Belgium | 98.4 /100 | #46 | Exceptional 4.3% |
| British | 98.3 /100 | #47 | Exceptional 4.4% |
| Bhutanese | 98.2 /100 | #48 | Exceptional 4.4% |
| Swiss | 98.2 /100 | #49 | Exceptional 4.4% |
| Immigrants | Turkey | 97.8 /100 | #50 | Exceptional 4.4% |
| Immigrants | Eastern Asia | 97.8 /100 | #51 | Exceptional 4.4% |
| Okinawans | 97.7 /100 | #52 | Exceptional 4.4% |
| Immigrants | Argentina | 97.6 /100 | #53 | Exceptional 4.4% |
| Asians | 97.4 /100 | #54 | Exceptional 4.4% |
| Immigrants | Moldova | 97.3 /100 | #55 | Exceptional 4.4% |
| Chileans | 97.3 /100 | #56 | Exceptional 4.4% |
| Immigrants | Hong Kong | 97.2 /100 | #57 | Exceptional 4.4% |
| English | 97.2 /100 | #58 | Exceptional 4.4% |
| Greeks | 97.1 /100 | #59 | Exceptional 4.4% |
Demographics Similar to Europeans by Unemployment Among Ages 35 to 44 years
In terms of unemployment among ages 35 to 44 years, the demographic groups most similar to Europeans are Immigrants from Pakistan (4.3%, a difference of 0.070%), Carpatho Rusyn (4.3%, a difference of 0.11%), Immigrants from Japan (4.3%, a difference of 0.20%), Chinese (4.3%, a difference of 0.20%), and Assyrian/Chaldean/Syriac (4.3%, a difference of 0.27%).
| Demographics | Rating | Rank | Unemployment Among Ages 35 to 44 years |
| Scandinavians | 99.5 /100 | #22 | Exceptional 4.2% |
| Immigrants | Kuwait | 99.5 /100 | #23 | Exceptional 4.3% |
| Tlingit-Haida | 99.5 /100 | #24 | Exceptional 4.3% |
| Bulgarians | 99.3 /100 | #25 | Exceptional 4.3% |
| Turks | 99.3 /100 | #26 | Exceptional 4.3% |
| Assyrians/Chaldeans/Syriacs | 99.3 /100 | #27 | Exceptional 4.3% |
| Immigrants | Japan | 99.3 /100 | #28 | Exceptional 4.3% |
| Europeans | 99.2 /100 | #29 | Exceptional 4.3% |
| Immigrants | Pakistan | 99.2 /100 | #30 | Exceptional 4.3% |
| Carpatho Rusyns | 99.2 /100 | #31 | Exceptional 4.3% |
| Chinese | 99.1 /100 | #32 | Exceptional 4.3% |
| Immigrants | Sri Lanka | 99.1 /100 | #33 | Exceptional 4.3% |
| Jordanians | 99.0 /100 | #34 | Exceptional 4.3% |
| Luxembourgers | 99.0 /100 | #35 | Exceptional 4.3% |
| Mongolians | 98.9 /100 | #36 | Exceptional 4.3% |