Northern European vs Hispanic or Latino Unemployment Among Ages 25 to 29 years
COMPARE
Northern European
Hispanic or Latino
Unemployment Among Ages 25 to 29 years
Unemployment Among Ages 25 to 29 years Comparison
Northern Europeans
Hispanics or Latinos
6.5%
UNEMPLOYMENT AMONG AGES 25 TO 29 YEARS
75.4/ 100
METRIC RATING
136th/ 347
METRIC RANK
7.7%
UNEMPLOYMENT AMONG AGES 25 TO 29 YEARS
0.0/ 100
METRIC RATING
291st/ 347
METRIC RANK
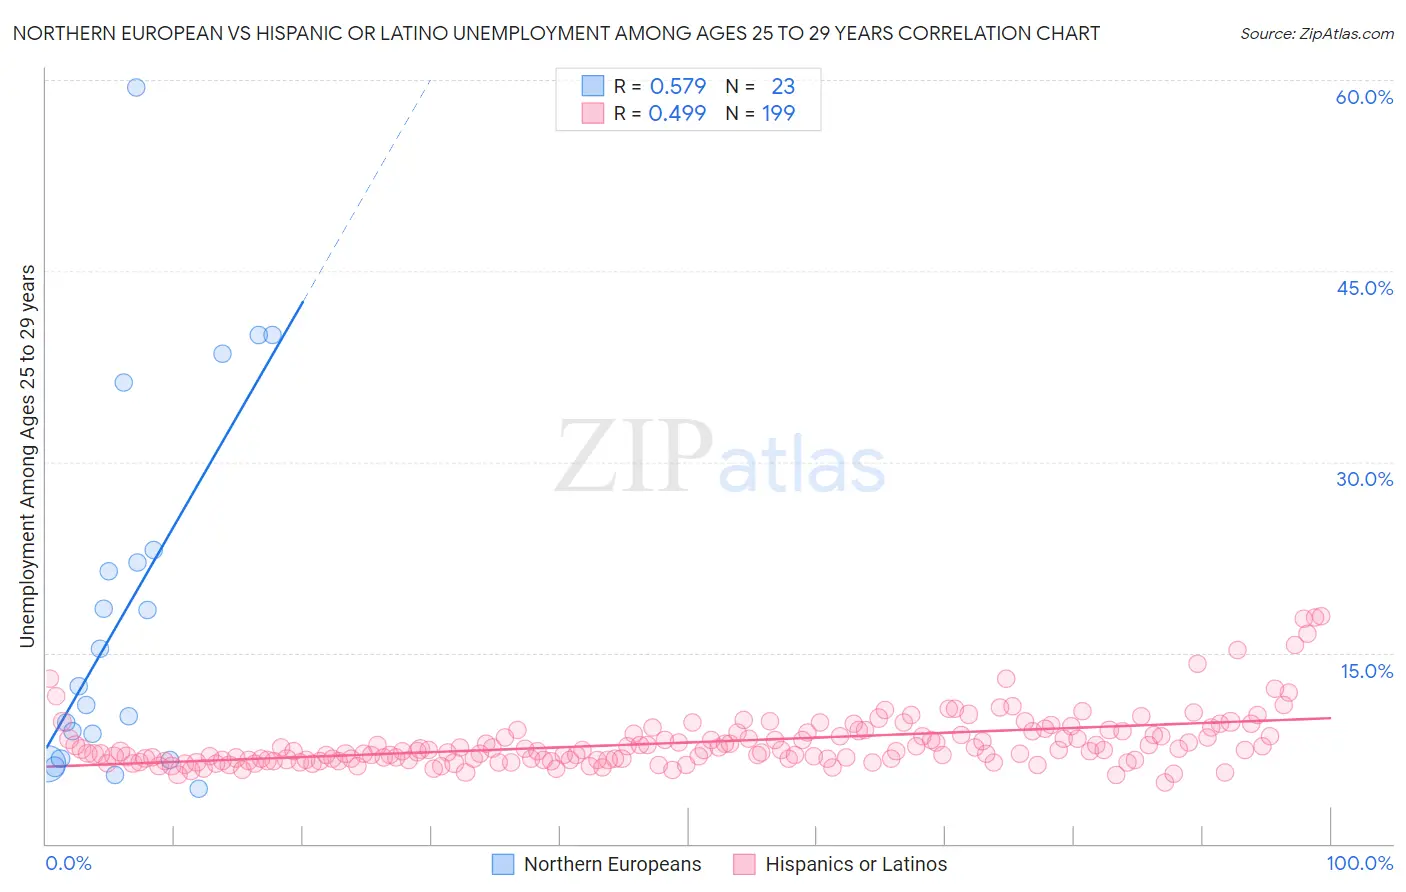
Northern European vs Hispanic or Latino Unemployment Among Ages 25 to 29 years Correlation Chart
The statistical analysis conducted on geographies consisting of 379,973,816 people shows a substantial positive correlation between the proportion of Northern Europeans and unemployment rate among population between the ages 25 and 29 in the United States with a correlation coefficient (R) of 0.579 and weighted average of 6.5%. Similarly, the statistical analysis conducted on geographies consisting of 511,176,704 people shows a moderate positive correlation between the proportion of Hispanics or Latinos and unemployment rate among population between the ages 25 and 29 in the United States with a correlation coefficient (R) of 0.499 and weighted average of 7.7%, a difference of 18.3%.
Unemployment Among Ages 25 to 29 years Correlation Summary
| Measurement | Northern European | Hispanic or Latino |
| Minimum | 4.3% | 4.8% |
| Maximum | 59.4% | 17.9% |
| Range | 55.1% | 13.1% |
| Mean | 18.6% | 7.9% |
| Median | 12.3% | 7.3% |
| Interquartile 25% (IQ1) | 6.7% | 6.6% |
| Interquartile 75% (IQ3) | 23.1% | 8.7% |
| Interquartile Range (IQR) | 16.4% | 2.1% |
| Standard Deviation (Sample) | 14.7% | 2.2% |
| Standard Deviation (Population) | 14.4% | 2.2% |
Similar Demographics by Unemployment Among Ages 25 to 29 years
Demographics Similar to Northern Europeans by Unemployment Among Ages 25 to 29 years
In terms of unemployment among ages 25 to 29 years, the demographic groups most similar to Northern Europeans are Immigrants from Croatia (6.5%, a difference of 0.010%), Immigrants from Vietnam (6.5%, a difference of 0.020%), Immigrants from Europe (6.5%, a difference of 0.030%), Polish (6.5%, a difference of 0.11%), and Eastern European (6.5%, a difference of 0.11%).
| Demographics | Rating | Rank | Unemployment Among Ages 25 to 29 years |
| Sri Lankans | 80.3 /100 | #129 | Excellent 6.5% |
| Immigrants | Peru | 79.9 /100 | #130 | Good 6.5% |
| Immigrants | Afghanistan | 79.2 /100 | #131 | Good 6.5% |
| Poles | 76.6 /100 | #132 | Good 6.5% |
| Immigrants | Europe | 75.7 /100 | #133 | Good 6.5% |
| Immigrants | Vietnam | 75.6 /100 | #134 | Good 6.5% |
| Immigrants | Croatia | 75.5 /100 | #135 | Good 6.5% |
| Northern Europeans | 75.4 /100 | #136 | Good 6.5% |
| Eastern Europeans | 74.1 /100 | #137 | Good 6.5% |
| Immigrants | Belgium | 73.8 /100 | #138 | Good 6.5% |
| Austrians | 73.8 /100 | #139 | Good 6.5% |
| Immigrants | Pakistan | 73.8 /100 | #140 | Good 6.5% |
| Maltese | 72.9 /100 | #141 | Good 6.5% |
| Slavs | 72.5 /100 | #142 | Good 6.5% |
| Lithuanians | 72.2 /100 | #143 | Good 6.5% |
Demographics Similar to Hispanics or Latinos by Unemployment Among Ages 25 to 29 years
In terms of unemployment among ages 25 to 29 years, the demographic groups most similar to Hispanics or Latinos are Armenian (7.7%, a difference of 0.39%), Chippewa (7.8%, a difference of 0.41%), Immigrants from Belize (7.8%, a difference of 0.46%), Belizean (7.7%, a difference of 0.49%), and Trinidadian and Tobagonian (7.8%, a difference of 0.74%).
| Demographics | Rating | Rank | Unemployment Among Ages 25 to 29 years |
| Cherokee | 0.0 /100 | #284 | Tragic 7.6% |
| Senegalese | 0.0 /100 | #285 | Tragic 7.6% |
| Vietnamese | 0.0 /100 | #286 | Tragic 7.6% |
| Immigrants | Mexico | 0.0 /100 | #287 | Tragic 7.6% |
| Africans | 0.0 /100 | #288 | Tragic 7.6% |
| Belizeans | 0.0 /100 | #289 | Tragic 7.7% |
| Armenians | 0.0 /100 | #290 | Tragic 7.7% |
| Hispanics or Latinos | 0.0 /100 | #291 | Tragic 7.7% |
| Chippewa | 0.0 /100 | #292 | Tragic 7.8% |
| Immigrants | Belize | 0.0 /100 | #293 | Tragic 7.8% |
| Trinidadians and Tobagonians | 0.0 /100 | #294 | Tragic 7.8% |
| Comanche | 0.0 /100 | #295 | Tragic 7.8% |
| Immigrants | West Indies | 0.0 /100 | #296 | Tragic 7.8% |
| Blackfeet | 0.0 /100 | #297 | Tragic 7.9% |
| Immigrants | Trinidad and Tobago | 0.0 /100 | #298 | Tragic 7.9% |