Nepalese vs Hispanic or Latino Unemployment Among Ages 25 to 29 years
COMPARE
Nepalese
Hispanic or Latino
Unemployment Among Ages 25 to 29 years
Unemployment Among Ages 25 to 29 years Comparison
Nepalese
Hispanics or Latinos
7.5%
UNEMPLOYMENT AMONG AGES 25 TO 29 YEARS
0.0/ 100
METRIC RATING
279th/ 347
METRIC RANK
7.7%
UNEMPLOYMENT AMONG AGES 25 TO 29 YEARS
0.0/ 100
METRIC RATING
291st/ 347
METRIC RANK
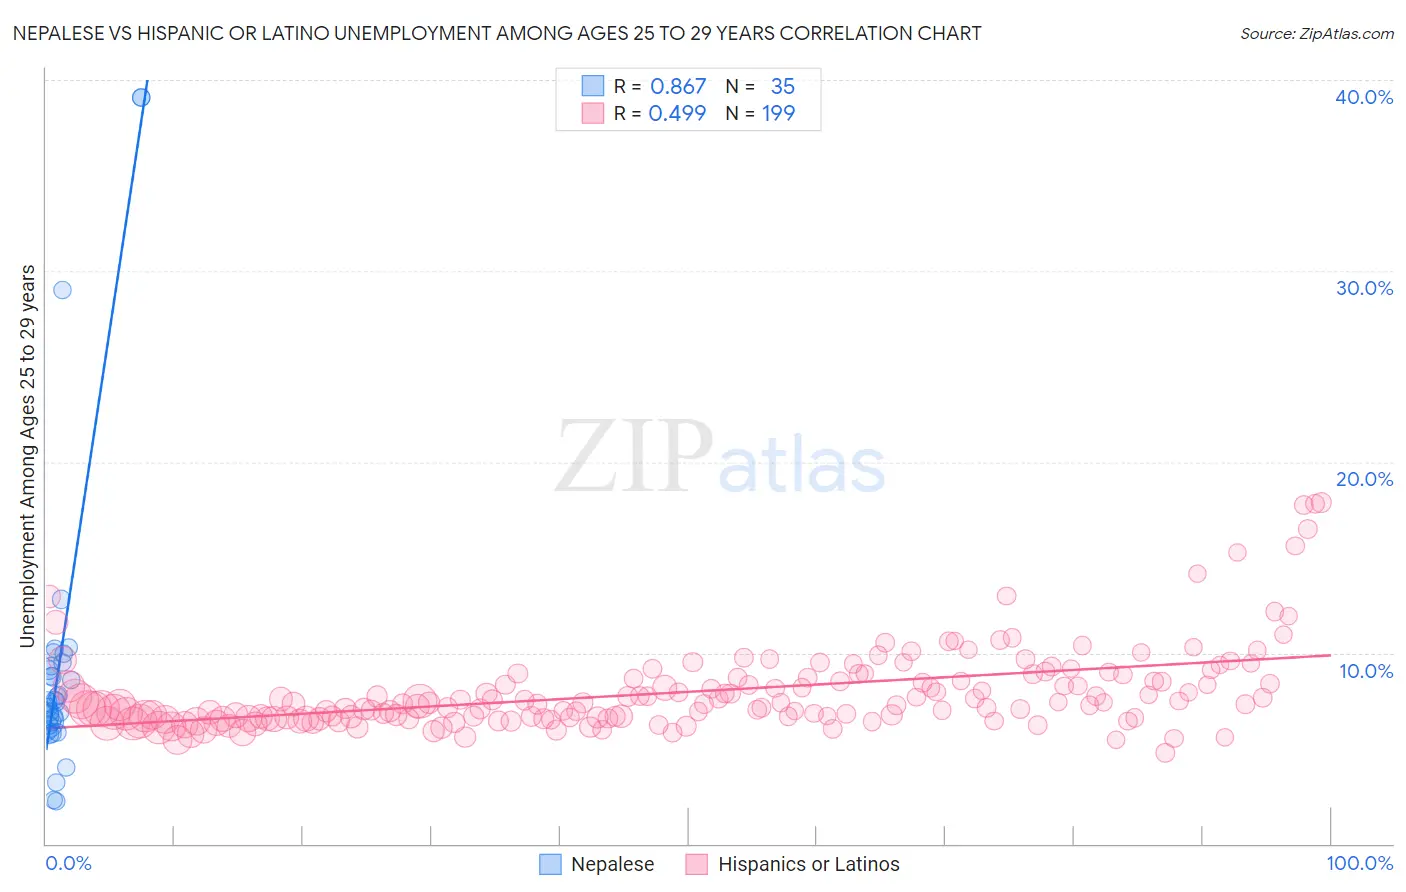
Nepalese vs Hispanic or Latino Unemployment Among Ages 25 to 29 years Correlation Chart
The statistical analysis conducted on geographies consisting of 24,366,935 people shows a very strong positive correlation between the proportion of Nepalese and unemployment rate among population between the ages 25 and 29 in the United States with a correlation coefficient (R) of 0.867 and weighted average of 7.5%. Similarly, the statistical analysis conducted on geographies consisting of 511,176,704 people shows a moderate positive correlation between the proportion of Hispanics or Latinos and unemployment rate among population between the ages 25 and 29 in the United States with a correlation coefficient (R) of 0.499 and weighted average of 7.7%, a difference of 2.7%.
Unemployment Among Ages 25 to 29 years Correlation Summary
| Measurement | Nepalese | Hispanic or Latino |
| Minimum | 2.2% | 4.8% |
| Maximum | 39.1% | 17.9% |
| Range | 36.9% | 13.1% |
| Mean | 9.7% | 7.9% |
| Median | 7.4% | 7.3% |
| Interquartile 25% (IQ1) | 6.2% | 6.6% |
| Interquartile 75% (IQ3) | 9.5% | 8.7% |
| Interquartile Range (IQR) | 3.3% | 2.1% |
| Standard Deviation (Sample) | 8.5% | 2.2% |
| Standard Deviation (Population) | 8.4% | 2.2% |
Demographics Similar to Nepalese and Hispanics or Latinos by Unemployment Among Ages 25 to 29 years
In terms of unemployment among ages 25 to 29 years, the demographic groups most similar to Nepalese are Mexican (7.5%, a difference of 0.13%), Immigrants from Caribbean (7.5%, a difference of 0.14%), Iroquois (7.5%, a difference of 0.17%), French American Indian (7.5%, a difference of 0.23%), and Immigrants from Bangladesh (7.5%, a difference of 0.23%). Similarly, the demographic groups most similar to Hispanics or Latinos are Armenian (7.7%, a difference of 0.39%), Chippewa (7.8%, a difference of 0.41%), Immigrants from Belize (7.8%, a difference of 0.46%), Belizean (7.7%, a difference of 0.49%), and Trinidadian and Tobagonian (7.8%, a difference of 0.74%).
| Demographics | Rating | Rank | Unemployment Among Ages 25 to 29 years |
| Immigrants | Ghana | 0.0 /100 | #275 | Tragic 7.5% |
| French American Indians | 0.0 /100 | #276 | Tragic 7.5% |
| Iroquois | 0.0 /100 | #277 | Tragic 7.5% |
| Mexicans | 0.0 /100 | #278 | Tragic 7.5% |
| Nepalese | 0.0 /100 | #279 | Tragic 7.5% |
| Immigrants | Caribbean | 0.0 /100 | #280 | Tragic 7.5% |
| Immigrants | Bangladesh | 0.0 /100 | #281 | Tragic 7.5% |
| Immigrants | Senegal | 0.0 /100 | #282 | Tragic 7.6% |
| Creek | 0.0 /100 | #283 | Tragic 7.6% |
| Cherokee | 0.0 /100 | #284 | Tragic 7.6% |
| Senegalese | 0.0 /100 | #285 | Tragic 7.6% |
| Vietnamese | 0.0 /100 | #286 | Tragic 7.6% |
| Immigrants | Mexico | 0.0 /100 | #287 | Tragic 7.6% |
| Africans | 0.0 /100 | #288 | Tragic 7.6% |
| Belizeans | 0.0 /100 | #289 | Tragic 7.7% |
| Armenians | 0.0 /100 | #290 | Tragic 7.7% |
| Hispanics or Latinos | 0.0 /100 | #291 | Tragic 7.7% |
| Chippewa | 0.0 /100 | #292 | Tragic 7.8% |
| Immigrants | Belize | 0.0 /100 | #293 | Tragic 7.8% |
| Trinidadians and Tobagonians | 0.0 /100 | #294 | Tragic 7.8% |
| Comanche | 0.0 /100 | #295 | Tragic 7.8% |