Nigerian vs Jamaican Unemployment Among Ages 55 to 59 years
COMPARE
Nigerian
Jamaican
Unemployment Among Ages 55 to 59 years
Unemployment Among Ages 55 to 59 years Comparison
Nigerians
Jamaicans
4.9%
UNEMPLOYMENT AMONG AGES 55 TO 59 YEARS
7.5/ 100
METRIC RATING
221st/ 347
METRIC RANK
5.2%
UNEMPLOYMENT AMONG AGES 55 TO 59 YEARS
0.1/ 100
METRIC RATING
266th/ 347
METRIC RANK
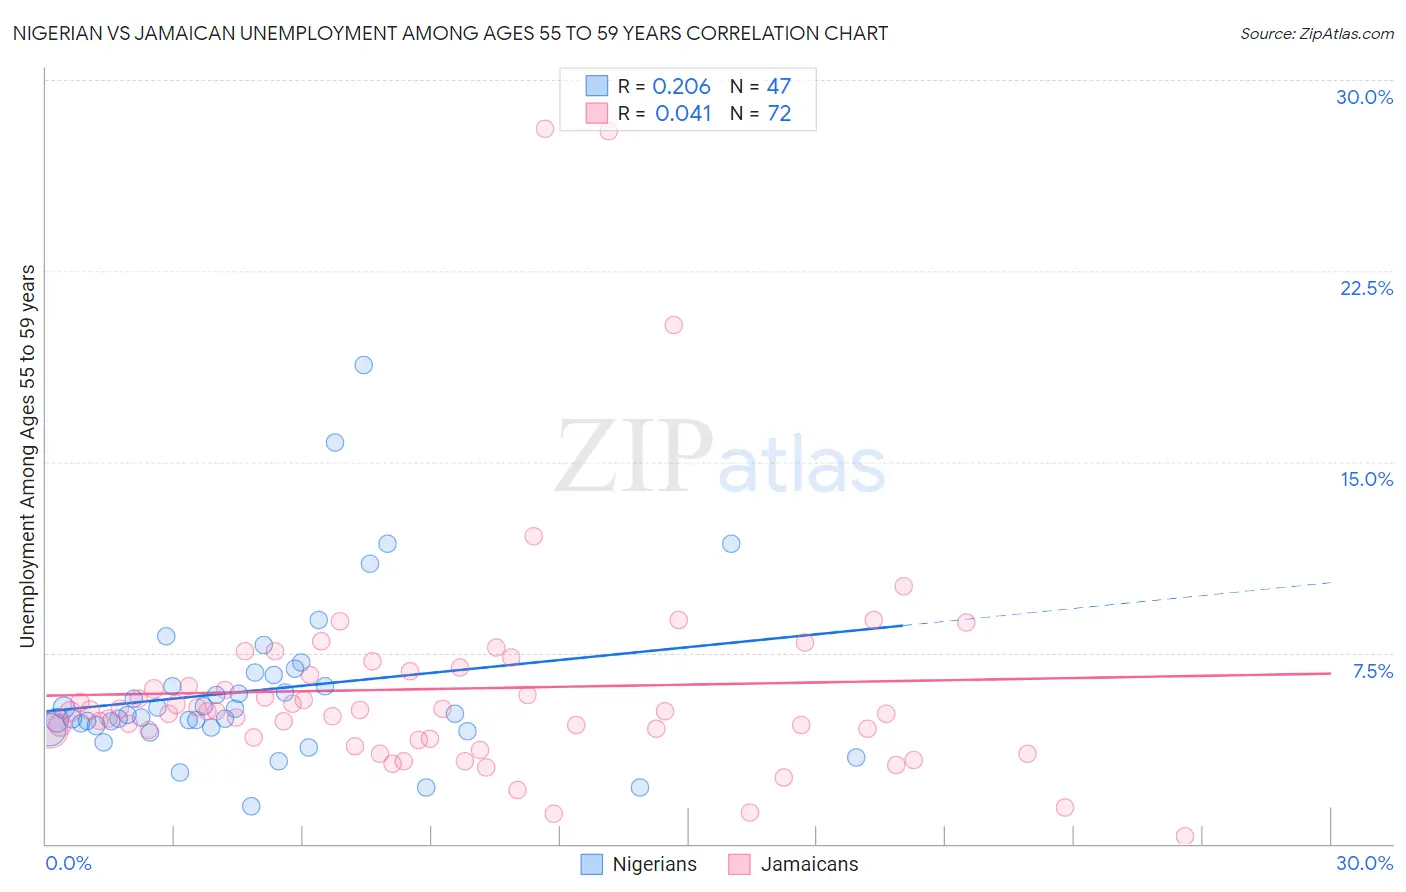
Nigerian vs Jamaican Unemployment Among Ages 55 to 59 years Correlation Chart
The statistical analysis conducted on geographies consisting of 315,211,232 people shows a weak positive correlation between the proportion of Nigerians and unemployment rate among population between the ages 55 and 59 in the United States with a correlation coefficient (R) of 0.206 and weighted average of 4.9%. Similarly, the statistical analysis conducted on geographies consisting of 344,870,220 people shows no correlation between the proportion of Jamaicans and unemployment rate among population between the ages 55 and 59 in the United States with a correlation coefficient (R) of 0.041 and weighted average of 5.2%, a difference of 4.5%.
Unemployment Among Ages 55 to 59 years Correlation Summary
| Measurement | Nigerian | Jamaican |
| Minimum | 1.5% | 0.30% |
| Maximum | 18.8% | 28.1% |
| Range | 17.3% | 27.8% |
| Mean | 6.0% | 6.1% |
| Median | 5.1% | 5.2% |
| Interquartile 25% (IQ1) | 4.6% | 4.2% |
| Interquartile 75% (IQ3) | 6.6% | 6.7% |
| Interquartile Range (IQR) | 2.1% | 2.6% |
| Standard Deviation (Sample) | 3.2% | 4.6% |
| Standard Deviation (Population) | 3.2% | 4.6% |
Similar Demographics by Unemployment Among Ages 55 to 59 years
Demographics Similar to Nigerians by Unemployment Among Ages 55 to 59 years
In terms of unemployment among ages 55 to 59 years, the demographic groups most similar to Nigerians are Indian (Asian) (4.9%, a difference of 0.010%), Immigrants from Austria (4.9%, a difference of 0.060%), Immigrants from Nigeria (4.9%, a difference of 0.060%), Spanish American (4.9%, a difference of 0.080%), and Immigrants from Brazil (4.9%, a difference of 0.080%).
| Demographics | Rating | Rank | Unemployment Among Ages 55 to 59 years |
| Immigrants | Denmark | 10.3 /100 | #214 | Poor 4.9% |
| Syrians | 8.6 /100 | #215 | Tragic 4.9% |
| Spanish Americans | 8.1 /100 | #216 | Tragic 4.9% |
| Immigrants | Brazil | 8.1 /100 | #217 | Tragic 4.9% |
| Immigrants | Austria | 8.0 /100 | #218 | Tragic 4.9% |
| Immigrants | Nigeria | 8.0 /100 | #219 | Tragic 4.9% |
| Indians (Asian) | 7.6 /100 | #220 | Tragic 4.9% |
| Nigerians | 7.5 /100 | #221 | Tragic 4.9% |
| Spanish | 5.1 /100 | #222 | Tragic 5.0% |
| Immigrants | Ireland | 4.8 /100 | #223 | Tragic 5.0% |
| Sub-Saharan Africans | 4.4 /100 | #224 | Tragic 5.0% |
| Costa Ricans | 4.4 /100 | #225 | Tragic 5.0% |
| Immigrants | China | 4.2 /100 | #226 | Tragic 5.0% |
| Immigrants | Iran | 3.7 /100 | #227 | Tragic 5.0% |
| Immigrants | Liberia | 3.2 /100 | #228 | Tragic 5.0% |
Demographics Similar to Jamaicans by Unemployment Among Ages 55 to 59 years
In terms of unemployment among ages 55 to 59 years, the demographic groups most similar to Jamaicans are Immigrants from Senegal (5.2%, a difference of 0.0%), Mexican (5.2%, a difference of 0.010%), Yaqui (5.2%, a difference of 0.030%), Tsimshian (5.2%, a difference of 0.040%), and Immigrants from Caribbean (5.2%, a difference of 0.090%).
| Demographics | Rating | Rank | Unemployment Among Ages 55 to 59 years |
| Immigrants | West Indies | 0.2 /100 | #259 | Tragic 5.1% |
| Immigrants | Western Africa | 0.2 /100 | #260 | Tragic 5.1% |
| Africans | 0.1 /100 | #261 | Tragic 5.1% |
| Immigrants | El Salvador | 0.1 /100 | #262 | Tragic 5.1% |
| Immigrants | Sierra Leone | 0.1 /100 | #263 | Tragic 5.2% |
| Immigrants | Caribbean | 0.1 /100 | #264 | Tragic 5.2% |
| Yaqui | 0.1 /100 | #265 | Tragic 5.2% |
| Jamaicans | 0.1 /100 | #266 | Tragic 5.2% |
| Immigrants | Senegal | 0.1 /100 | #267 | Tragic 5.2% |
| Mexicans | 0.1 /100 | #268 | Tragic 5.2% |
| Tsimshian | 0.1 /100 | #269 | Tragic 5.2% |
| Ute | 0.1 /100 | #270 | Tragic 5.2% |
| Cree | 0.1 /100 | #271 | Tragic 5.2% |
| Immigrants | Jamaica | 0.0 /100 | #272 | Tragic 5.2% |
| Ottawa | 0.0 /100 | #273 | Tragic 5.2% |