Indonesian vs Jamaican Unemployment Among Ages 55 to 59 years
COMPARE
Indonesian
Jamaican
Unemployment Among Ages 55 to 59 years
Unemployment Among Ages 55 to 59 years Comparison
Indonesians
Jamaicans
4.3%
UNEMPLOYMENT AMONG AGES 55 TO 59 YEARS
100.0/ 100
METRIC RATING
13th/ 347
METRIC RANK
5.2%
UNEMPLOYMENT AMONG AGES 55 TO 59 YEARS
0.1/ 100
METRIC RATING
266th/ 347
METRIC RANK
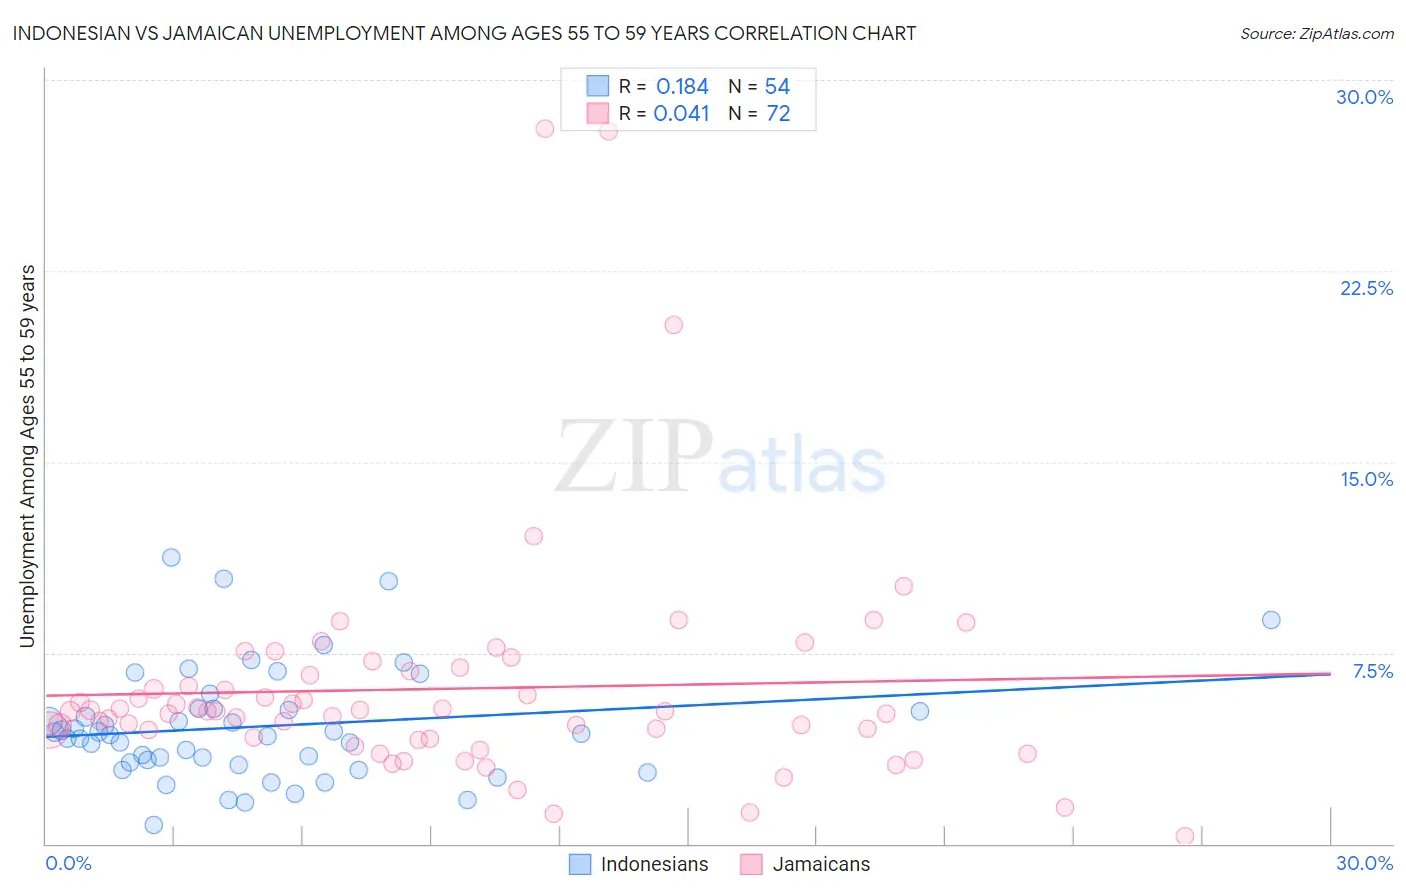
Indonesian vs Jamaican Unemployment Among Ages 55 to 59 years Correlation Chart
The statistical analysis conducted on geographies consisting of 158,064,684 people shows a poor positive correlation between the proportion of Indonesians and unemployment rate among population between the ages 55 and 59 in the United States with a correlation coefficient (R) of 0.184 and weighted average of 4.3%. Similarly, the statistical analysis conducted on geographies consisting of 344,870,220 people shows no correlation between the proportion of Jamaicans and unemployment rate among population between the ages 55 and 59 in the United States with a correlation coefficient (R) of 0.041 and weighted average of 5.2%, a difference of 19.4%.
Unemployment Among Ages 55 to 59 years Correlation Summary
| Measurement | Indonesian | Jamaican |
| Minimum | 0.72% | 0.30% |
| Maximum | 11.2% | 28.1% |
| Range | 10.5% | 27.8% |
| Mean | 4.6% | 6.1% |
| Median | 4.3% | 5.2% |
| Interquartile 25% (IQ1) | 3.2% | 4.2% |
| Interquartile 75% (IQ3) | 5.3% | 6.7% |
| Interquartile Range (IQR) | 2.1% | 2.6% |
| Standard Deviation (Sample) | 2.2% | 4.6% |
| Standard Deviation (Population) | 2.2% | 4.6% |
Similar Demographics by Unemployment Among Ages 55 to 59 years
Demographics Similar to Indonesians by Unemployment Among Ages 55 to 59 years
In terms of unemployment among ages 55 to 59 years, the demographic groups most similar to Indonesians are Immigrants from India (4.3%, a difference of 0.16%), Danish (4.3%, a difference of 0.26%), Bulgarian (4.3%, a difference of 0.42%), Immigrants from Congo (4.3%, a difference of 0.45%), and Somali (4.4%, a difference of 0.65%).
| Demographics | Rating | Rank | Unemployment Among Ages 55 to 59 years |
| Norwegians | 100.0 /100 | #6 | Exceptional 4.2% |
| Zimbabweans | 100.0 /100 | #7 | Exceptional 4.2% |
| Bolivians | 100.0 /100 | #8 | Exceptional 4.2% |
| Cubans | 100.0 /100 | #9 | Exceptional 4.2% |
| Tongans | 100.0 /100 | #10 | Exceptional 4.3% |
| Immigrants | Congo | 100.0 /100 | #11 | Exceptional 4.3% |
| Danes | 100.0 /100 | #12 | Exceptional 4.3% |
| Indonesians | 100.0 /100 | #13 | Exceptional 4.3% |
| Immigrants | India | 100.0 /100 | #14 | Exceptional 4.3% |
| Bulgarians | 100.0 /100 | #15 | Exceptional 4.3% |
| Somalis | 100.0 /100 | #16 | Exceptional 4.4% |
| Czechs | 100.0 /100 | #17 | Exceptional 4.4% |
| Immigrants | Somalia | 100.0 /100 | #18 | Exceptional 4.4% |
| Chinese | 100.0 /100 | #19 | Exceptional 4.4% |
| Swedes | 100.0 /100 | #20 | Exceptional 4.4% |
Demographics Similar to Jamaicans by Unemployment Among Ages 55 to 59 years
In terms of unemployment among ages 55 to 59 years, the demographic groups most similar to Jamaicans are Immigrants from Senegal (5.2%, a difference of 0.0%), Mexican (5.2%, a difference of 0.010%), Yaqui (5.2%, a difference of 0.030%), Tsimshian (5.2%, a difference of 0.040%), and Immigrants from Caribbean (5.2%, a difference of 0.090%).
| Demographics | Rating | Rank | Unemployment Among Ages 55 to 59 years |
| Immigrants | West Indies | 0.2 /100 | #259 | Tragic 5.1% |
| Immigrants | Western Africa | 0.2 /100 | #260 | Tragic 5.1% |
| Africans | 0.1 /100 | #261 | Tragic 5.1% |
| Immigrants | El Salvador | 0.1 /100 | #262 | Tragic 5.1% |
| Immigrants | Sierra Leone | 0.1 /100 | #263 | Tragic 5.2% |
| Immigrants | Caribbean | 0.1 /100 | #264 | Tragic 5.2% |
| Yaqui | 0.1 /100 | #265 | Tragic 5.2% |
| Jamaicans | 0.1 /100 | #266 | Tragic 5.2% |
| Immigrants | Senegal | 0.1 /100 | #267 | Tragic 5.2% |
| Mexicans | 0.1 /100 | #268 | Tragic 5.2% |
| Tsimshian | 0.1 /100 | #269 | Tragic 5.2% |
| Ute | 0.1 /100 | #270 | Tragic 5.2% |
| Cree | 0.1 /100 | #271 | Tragic 5.2% |
| Immigrants | Jamaica | 0.0 /100 | #272 | Tragic 5.2% |
| Ottawa | 0.0 /100 | #273 | Tragic 5.2% |