Nicaraguan vs Immigrants from Venezuela Unemployment Among Seniors over 75 years
COMPARE
Nicaraguan
Immigrants from Venezuela
Unemployment Among Seniors over 75 years
Unemployment Among Seniors over 75 years Comparison
Nicaraguans
Immigrants from Venezuela
8.2%
UNEMPLOYMENT AMONG SENIORS OVER 75 YEARS
99.3/ 100
METRIC RATING
95th/ 347
METRIC RANK
8.0%
UNEMPLOYMENT AMONG SENIORS OVER 75 YEARS
99.8/ 100
METRIC RATING
76th/ 347
METRIC RANK
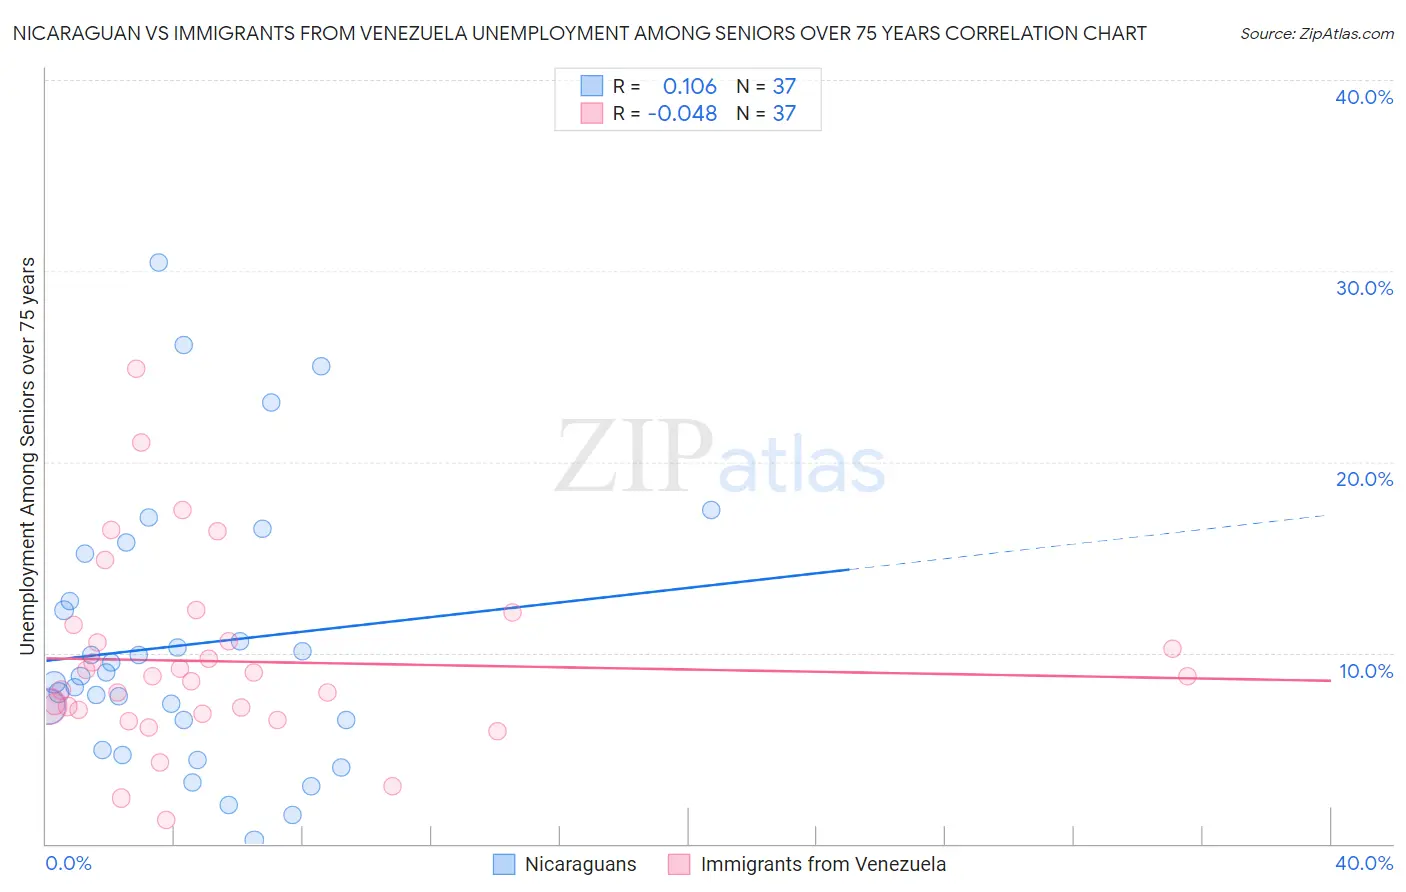
Nicaraguan vs Immigrants from Venezuela Unemployment Among Seniors over 75 years Correlation Chart
The statistical analysis conducted on geographies consisting of 165,721,244 people shows a poor positive correlation between the proportion of Nicaraguans and unemployment rate among seniors over the age of 75 in the United States with a correlation coefficient (R) of 0.106 and weighted average of 8.2%. Similarly, the statistical analysis conducted on geographies consisting of 164,764,694 people shows no correlation between the proportion of Immigrants from Venezuela and unemployment rate among seniors over the age of 75 in the United States with a correlation coefficient (R) of -0.048 and weighted average of 8.0%, a difference of 1.7%.
Unemployment Among Seniors over 75 years Correlation Summary
| Measurement | Nicaraguan | Immigrants from Venezuela |
| Minimum | 0.20% | 1.3% |
| Maximum | 30.4% | 24.9% |
| Range | 30.2% | 23.6% |
| Mean | 10.4% | 9.5% |
| Median | 8.8% | 8.8% |
| Interquartile 25% (IQ1) | 5.7% | 6.9% |
| Interquartile 75% (IQ3) | 13.9% | 11.0% |
| Interquartile Range (IQR) | 8.2% | 4.1% |
| Standard Deviation (Sample) | 7.1% | 4.9% |
| Standard Deviation (Population) | 7.0% | 4.8% |
Demographics Similar to Nicaraguans and Immigrants from Venezuela by Unemployment Among Seniors over 75 years
In terms of unemployment among seniors over 75 years, the demographic groups most similar to Nicaraguans are Immigrants from Ireland (8.1%, a difference of 0.25%), Immigrants from Netherlands (8.1%, a difference of 0.28%), Venezuelan (8.1%, a difference of 0.36%), Egyptian (8.1%, a difference of 0.37%), and Immigrants from Vietnam (8.1%, a difference of 0.41%). Similarly, the demographic groups most similar to Immigrants from Venezuela are Immigrants from Turkey (8.0%, a difference of 0.050%), Immigrants from Belarus (8.0%, a difference of 0.080%), Immigrants from Uganda (8.0%, a difference of 0.11%), Immigrants from Japan (8.0%, a difference of 0.28%), and Immigrants from Australia (8.0%, a difference of 0.30%).
| Demographics | Rating | Rank | Unemployment Among Seniors over 75 years |
| Immigrants | Uganda | 99.8 /100 | #75 | Exceptional 8.0% |
| Immigrants | Venezuela | 99.8 /100 | #76 | Exceptional 8.0% |
| Immigrants | Turkey | 99.8 /100 | #77 | Exceptional 8.0% |
| Immigrants | Belarus | 99.8 /100 | #78 | Exceptional 8.0% |
| Immigrants | Japan | 99.7 /100 | #79 | Exceptional 8.0% |
| Immigrants | Australia | 99.7 /100 | #80 | Exceptional 8.0% |
| Cubans | 99.7 /100 | #81 | Exceptional 8.0% |
| Bhutanese | 99.7 /100 | #82 | Exceptional 8.0% |
| Arapaho | 99.7 /100 | #83 | Exceptional 8.1% |
| U.S. Virgin Islanders | 99.7 /100 | #84 | Exceptional 8.1% |
| Immigrants | Indonesia | 99.7 /100 | #85 | Exceptional 8.1% |
| Immigrants | Singapore | 99.7 /100 | #86 | Exceptional 8.1% |
| Basques | 99.5 /100 | #87 | Exceptional 8.1% |
| New Zealanders | 99.5 /100 | #88 | Exceptional 8.1% |
| Immigrants | Korea | 99.5 /100 | #89 | Exceptional 8.1% |
| Immigrants | Vietnam | 99.5 /100 | #90 | Exceptional 8.1% |
| Egyptians | 99.5 /100 | #91 | Exceptional 8.1% |
| Venezuelans | 99.5 /100 | #92 | Exceptional 8.1% |
| Immigrants | Netherlands | 99.5 /100 | #93 | Exceptional 8.1% |
| Immigrants | Ireland | 99.4 /100 | #94 | Exceptional 8.1% |
| Nicaraguans | 99.3 /100 | #95 | Exceptional 8.2% |