Iranian vs Immigrants from Venezuela Unemployment Among Seniors over 75 years
COMPARE
Iranian
Immigrants from Venezuela
Unemployment Among Seniors over 75 years
Unemployment Among Seniors over 75 years Comparison
Iranians
Immigrants from Venezuela
7.9%
UNEMPLOYMENT AMONG SENIORS OVER 75 YEARS
99.9/ 100
METRIC RATING
58th/ 347
METRIC RANK
8.0%
UNEMPLOYMENT AMONG SENIORS OVER 75 YEARS
99.8/ 100
METRIC RATING
76th/ 347
METRIC RANK
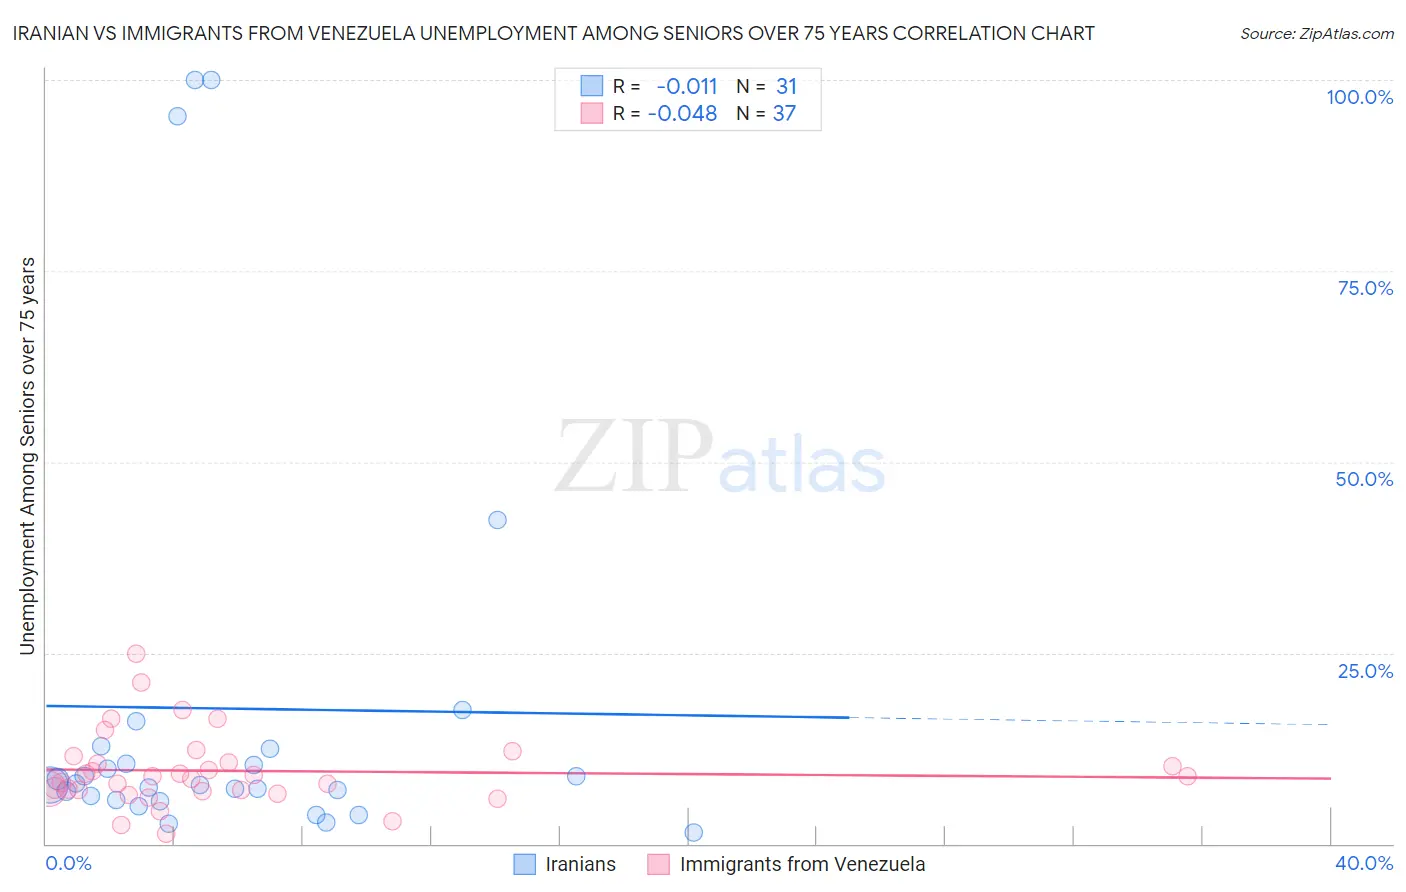
Iranian vs Immigrants from Venezuela Unemployment Among Seniors over 75 years Correlation Chart
The statistical analysis conducted on geographies consisting of 179,955,362 people shows no correlation between the proportion of Iranians and unemployment rate among seniors over the age of 75 in the United States with a correlation coefficient (R) of -0.011 and weighted average of 7.9%. Similarly, the statistical analysis conducted on geographies consisting of 164,764,694 people shows no correlation between the proportion of Immigrants from Venezuela and unemployment rate among seniors over the age of 75 in the United States with a correlation coefficient (R) of -0.048 and weighted average of 8.0%, a difference of 1.6%.
Unemployment Among Seniors over 75 years Correlation Summary
| Measurement | Iranian | Immigrants from Venezuela |
| Minimum | 1.4% | 1.3% |
| Maximum | 100.0% | 24.9% |
| Range | 98.6% | 23.6% |
| Mean | 17.7% | 9.5% |
| Median | 7.7% | 8.8% |
| Interquartile 25% (IQ1) | 5.7% | 6.9% |
| Interquartile 75% (IQ3) | 12.4% | 11.0% |
| Interquartile Range (IQR) | 6.7% | 4.1% |
| Standard Deviation (Sample) | 27.8% | 4.9% |
| Standard Deviation (Population) | 27.3% | 4.8% |
Demographics Similar to Iranians and Immigrants from Venezuela by Unemployment Among Seniors over 75 years
In terms of unemployment among seniors over 75 years, the demographic groups most similar to Iranians are Ottawa (7.9%, a difference of 0.050%), Indonesian (7.9%, a difference of 0.20%), Immigrants from Morocco (7.9%, a difference of 0.25%), Uruguayan (7.9%, a difference of 0.28%), and Immigrants from Albania (7.9%, a difference of 0.31%). Similarly, the demographic groups most similar to Immigrants from Venezuela are Immigrants from Turkey (8.0%, a difference of 0.050%), Immigrants from Uganda (8.0%, a difference of 0.11%), Spanish American (8.0%, a difference of 0.45%), Immigrants from France (8.0%, a difference of 0.50%), and Bolivian (8.0%, a difference of 0.54%).
| Demographics | Rating | Rank | Unemployment Among Seniors over 75 years |
| Ottawa | 99.9 /100 | #57 | Exceptional 7.9% |
| Iranians | 99.9 /100 | #58 | Exceptional 7.9% |
| Indonesians | 99.9 /100 | #59 | Exceptional 7.9% |
| Immigrants | Morocco | 99.9 /100 | #60 | Exceptional 7.9% |
| Uruguayans | 99.9 /100 | #61 | Exceptional 7.9% |
| Immigrants | Albania | 99.9 /100 | #62 | Exceptional 7.9% |
| Immigrants | Nicaragua | 99.9 /100 | #63 | Exceptional 7.9% |
| Immigrants | Taiwan | 99.9 /100 | #64 | Exceptional 7.9% |
| Argentineans | 99.9 /100 | #65 | Exceptional 7.9% |
| Immigrants | Austria | 99.9 /100 | #66 | Exceptional 8.0% |
| Immigrants | Syria | 99.9 /100 | #67 | Exceptional 8.0% |
| Immigrants | South Africa | 99.9 /100 | #68 | Exceptional 8.0% |
| Indians (Asian) | 99.9 /100 | #69 | Exceptional 8.0% |
| Immigrants | Argentina | 99.9 /100 | #70 | Exceptional 8.0% |
| Immigrants | Cambodia | 99.9 /100 | #71 | Exceptional 8.0% |
| Bolivians | 99.9 /100 | #72 | Exceptional 8.0% |
| Immigrants | France | 99.9 /100 | #73 | Exceptional 8.0% |
| Spanish Americans | 99.8 /100 | #74 | Exceptional 8.0% |
| Immigrants | Uganda | 99.8 /100 | #75 | Exceptional 8.0% |
| Immigrants | Venezuela | 99.8 /100 | #76 | Exceptional 8.0% |
| Immigrants | Turkey | 99.8 /100 | #77 | Exceptional 8.0% |