New Zealander vs Tsimshian Unemployment Among Ages 55 to 59 years
COMPARE
New Zealander
Tsimshian
Unemployment Among Ages 55 to 59 years
Unemployment Among Ages 55 to 59 years Comparison
New Zealanders
Tsimshian
4.7%
UNEMPLOYMENT AMONG AGES 55 TO 59 YEARS
96.3/ 100
METRIC RATING
91st/ 347
METRIC RANK
5.2%
UNEMPLOYMENT AMONG AGES 55 TO 59 YEARS
0.1/ 100
METRIC RATING
269th/ 347
METRIC RANK
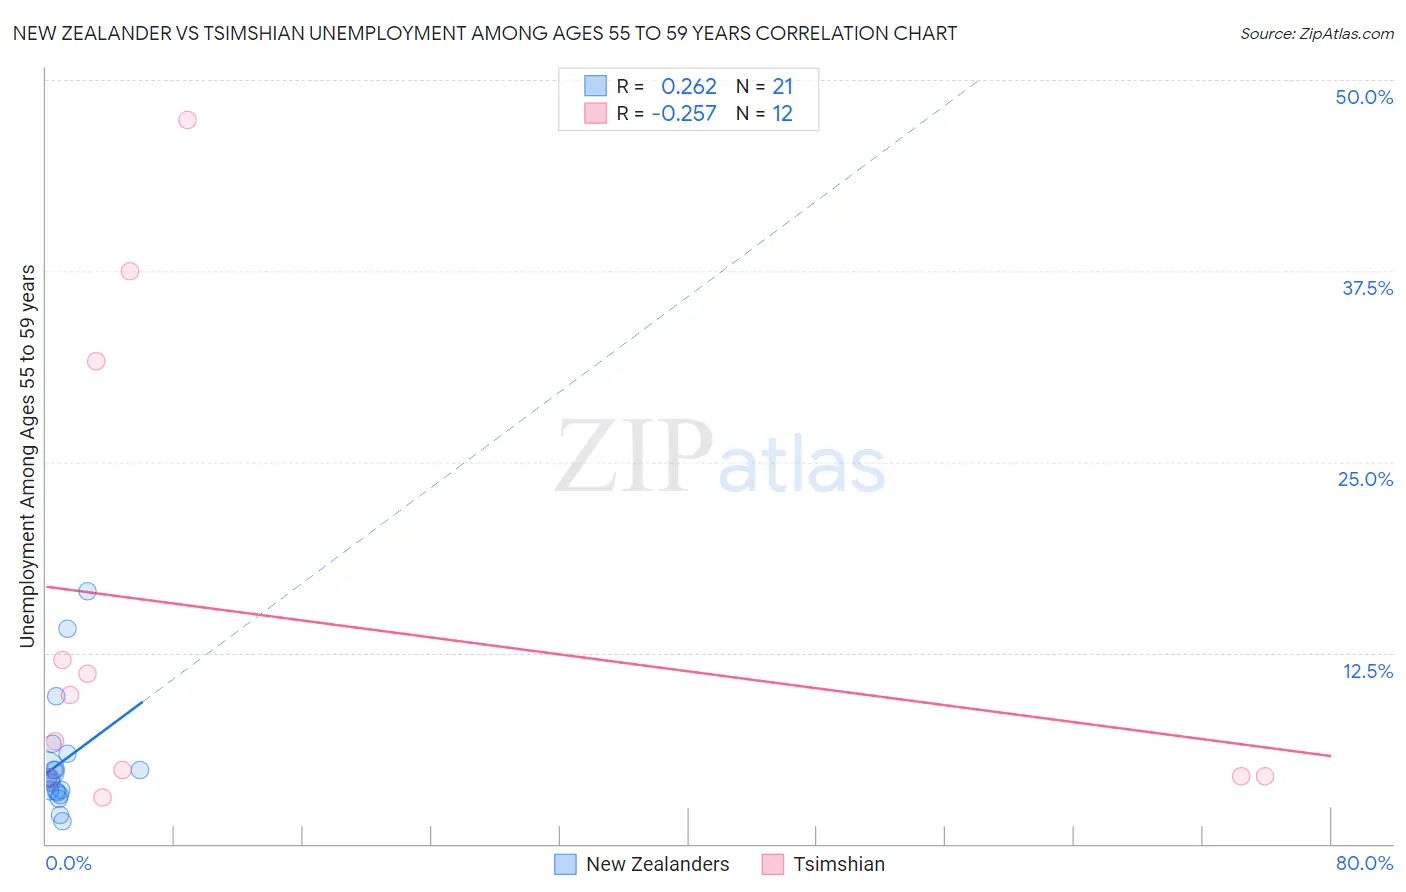
New Zealander vs Tsimshian Unemployment Among Ages 55 to 59 years Correlation Chart
The statistical analysis conducted on geographies consisting of 104,162,247 people shows a weak positive correlation between the proportion of New Zealanders and unemployment rate among population between the ages 55 and 59 in the United States with a correlation coefficient (R) of 0.262 and weighted average of 4.7%. Similarly, the statistical analysis conducted on geographies consisting of 15,380,482 people shows a weak negative correlation between the proportion of Tsimshian and unemployment rate among population between the ages 55 and 59 in the United States with a correlation coefficient (R) of -0.257 and weighted average of 5.2%, a difference of 10.9%.
Unemployment Among Ages 55 to 59 years Correlation Summary
| Measurement | New Zealander | Tsimshian |
| Minimum | 1.5% | 3.0% |
| Maximum | 16.5% | 47.4% |
| Range | 15.0% | 44.4% |
| Mean | 5.3% | 14.7% |
| Median | 4.4% | 8.2% |
| Interquartile 25% (IQ1) | 3.4% | 4.4% |
| Interquartile 75% (IQ3) | 5.4% | 21.8% |
| Interquartile Range (IQR) | 2.0% | 17.4% |
| Standard Deviation (Sample) | 3.7% | 15.2% |
| Standard Deviation (Population) | 3.6% | 14.6% |
Similar Demographics by Unemployment Among Ages 55 to 59 years
Demographics Similar to New Zealanders by Unemployment Among Ages 55 to 59 years
In terms of unemployment among ages 55 to 59 years, the demographic groups most similar to New Zealanders are Immigrants from Poland (4.7%, a difference of 0.020%), Iraqi (4.7%, a difference of 0.080%), Irish (4.7%, a difference of 0.15%), Immigrants from England (4.7%, a difference of 0.16%), and Immigrants from Scotland (4.7%, a difference of 0.16%).
| Demographics | Rating | Rank | Unemployment Among Ages 55 to 59 years |
| Malaysians | 96.9 /100 | #84 | Exceptional 4.7% |
| Immigrants | Vietnam | 96.9 /100 | #85 | Exceptional 4.7% |
| Immigrants | Colombia | 96.9 /100 | #86 | Exceptional 4.7% |
| Poles | 96.9 /100 | #87 | Exceptional 4.7% |
| Immigrants | Cameroon | 96.9 /100 | #88 | Exceptional 4.7% |
| Irish | 96.8 /100 | #89 | Exceptional 4.7% |
| Immigrants | Poland | 96.4 /100 | #90 | Exceptional 4.7% |
| New Zealanders | 96.3 /100 | #91 | Exceptional 4.7% |
| Iraqis | 96.1 /100 | #92 | Exceptional 4.7% |
| Immigrants | England | 95.8 /100 | #93 | Exceptional 4.7% |
| Immigrants | Scotland | 95.7 /100 | #94 | Exceptional 4.7% |
| South Africans | 95.6 /100 | #95 | Exceptional 4.7% |
| Immigrants | Belgium | 95.0 /100 | #96 | Exceptional 4.7% |
| Immigrants | Canada | 94.9 /100 | #97 | Exceptional 4.7% |
| Immigrants | Germany | 94.8 /100 | #98 | Exceptional 4.7% |
Demographics Similar to Tsimshian by Unemployment Among Ages 55 to 59 years
In terms of unemployment among ages 55 to 59 years, the demographic groups most similar to Tsimshian are Mexican (5.2%, a difference of 0.020%), Immigrants from Senegal (5.2%, a difference of 0.030%), Jamaican (5.2%, a difference of 0.040%), Yaqui (5.2%, a difference of 0.060%), and Immigrants from Caribbean (5.2%, a difference of 0.12%).
| Demographics | Rating | Rank | Unemployment Among Ages 55 to 59 years |
| Immigrants | El Salvador | 0.1 /100 | #262 | Tragic 5.1% |
| Immigrants | Sierra Leone | 0.1 /100 | #263 | Tragic 5.2% |
| Immigrants | Caribbean | 0.1 /100 | #264 | Tragic 5.2% |
| Yaqui | 0.1 /100 | #265 | Tragic 5.2% |
| Jamaicans | 0.1 /100 | #266 | Tragic 5.2% |
| Immigrants | Senegal | 0.1 /100 | #267 | Tragic 5.2% |
| Mexicans | 0.1 /100 | #268 | Tragic 5.2% |
| Tsimshian | 0.1 /100 | #269 | Tragic 5.2% |
| Ute | 0.1 /100 | #270 | Tragic 5.2% |
| Cree | 0.1 /100 | #271 | Tragic 5.2% |
| Immigrants | Jamaica | 0.0 /100 | #272 | Tragic 5.2% |
| Ottawa | 0.0 /100 | #273 | Tragic 5.2% |
| Mexican American Indians | 0.0 /100 | #274 | Tragic 5.2% |
| Israelis | 0.0 /100 | #275 | Tragic 5.2% |
| West Indians | 0.0 /100 | #276 | Tragic 5.2% |