New Zealander vs Immigrants from Haiti Unemployment Among Seniors over 65 years
COMPARE
New Zealander
Immigrants from Haiti
Unemployment Among Seniors over 65 years
Unemployment Among Seniors over 65 years Comparison
New Zealanders
Immigrants from Haiti
5.1%
UNEMPLOYMENT AMONG SENIORS OVER 65 YEARS
83.2/ 100
METRIC RATING
138th/ 347
METRIC RANK
5.5%
UNEMPLOYMENT AMONG SENIORS OVER 65 YEARS
0.0/ 100
METRIC RATING
283rd/ 347
METRIC RANK
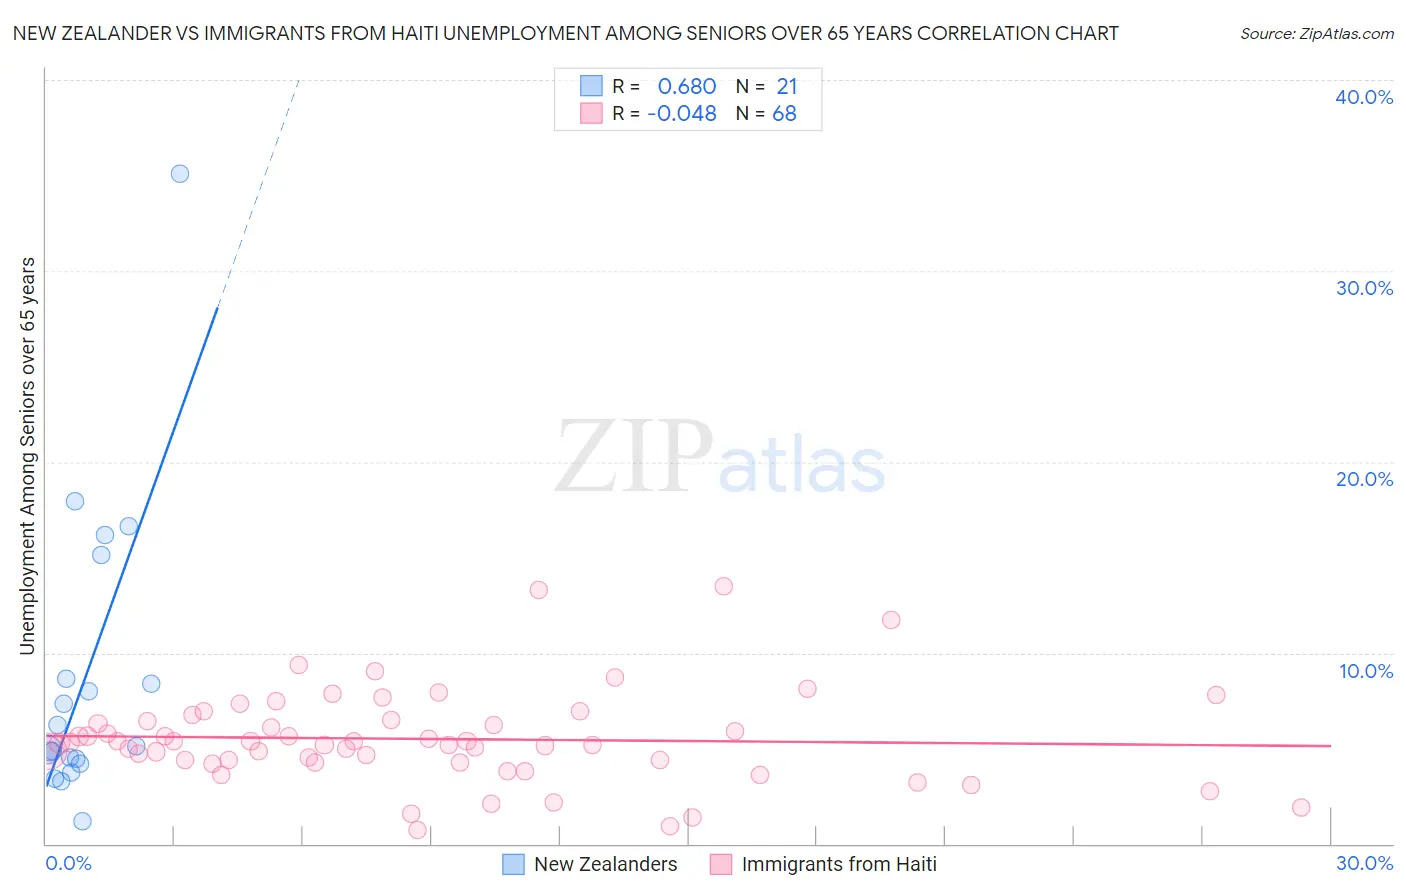
New Zealander vs Immigrants from Haiti Unemployment Among Seniors over 65 years Correlation Chart
The statistical analysis conducted on geographies consisting of 103,565,974 people shows a significant positive correlation between the proportion of New Zealanders and unemployment rate amomg seniors over the age of 65 in the United States with a correlation coefficient (R) of 0.680 and weighted average of 5.1%. Similarly, the statistical analysis conducted on geographies consisting of 211,616,700 people shows no correlation between the proportion of Immigrants from Haiti and unemployment rate amomg seniors over the age of 65 in the United States with a correlation coefficient (R) of -0.048 and weighted average of 5.5%, a difference of 7.9%.
Unemployment Among Seniors over 65 years Correlation Summary
| Measurement | New Zealander | Immigrants from Haiti |
| Minimum | 1.2% | 0.70% |
| Maximum | 35.1% | 13.5% |
| Range | 33.9% | 12.8% |
| Mean | 8.8% | 5.5% |
| Median | 5.1% | 5.3% |
| Interquartile 25% (IQ1) | 4.3% | 4.3% |
| Interquartile 75% (IQ3) | 11.9% | 6.4% |
| Interquartile Range (IQR) | 7.5% | 2.1% |
| Standard Deviation (Sample) | 7.8% | 2.5% |
| Standard Deviation (Population) | 7.6% | 2.4% |
Similar Demographics by Unemployment Among Seniors over 65 years
Demographics Similar to New Zealanders by Unemployment Among Seniors over 65 years
In terms of unemployment among seniors over 65 years, the demographic groups most similar to New Zealanders are Immigrants from Panama (5.1%, a difference of 0.010%), Immigrants from Chile (5.1%, a difference of 0.020%), Arab (5.1%, a difference of 0.060%), Ukrainian (5.1%, a difference of 0.070%), and White/Caucasian (5.1%, a difference of 0.070%).
| Demographics | Rating | Rank | Unemployment Among Seniors over 65 years |
| Immigrants | Australia | 85.8 /100 | #131 | Excellent 5.1% |
| Chileans | 85.6 /100 | #132 | Excellent 5.1% |
| Syrians | 85.3 /100 | #133 | Excellent 5.1% |
| Turks | 84.9 /100 | #134 | Excellent 5.1% |
| Ukrainians | 84.4 /100 | #135 | Excellent 5.1% |
| Whites/Caucasians | 84.4 /100 | #136 | Excellent 5.1% |
| Arabs | 84.3 /100 | #137 | Excellent 5.1% |
| New Zealanders | 83.2 /100 | #138 | Excellent 5.1% |
| Immigrants | Panama | 83.0 /100 | #139 | Excellent 5.1% |
| Immigrants | Chile | 83.0 /100 | #140 | Excellent 5.1% |
| Cherokee | 81.6 /100 | #141 | Excellent 5.1% |
| Immigrants | Indonesia | 81.0 /100 | #142 | Excellent 5.1% |
| Senegalese | 80.4 /100 | #143 | Excellent 5.1% |
| Poles | 80.3 /100 | #144 | Excellent 5.1% |
| Spanish | 78.8 /100 | #145 | Good 5.1% |
Demographics Similar to Immigrants from Haiti by Unemployment Among Seniors over 65 years
In terms of unemployment among seniors over 65 years, the demographic groups most similar to Immigrants from Haiti are Immigrants from Belize (5.5%, a difference of 0.19%), Immigrants from Liberia (5.5%, a difference of 0.31%), Immigrants from Norway (5.5%, a difference of 0.32%), Central American (5.5%, a difference of 0.37%), and Immigrants from Barbados (5.5%, a difference of 0.40%).
| Demographics | Rating | Rank | Unemployment Among Seniors over 65 years |
| Pueblo | 0.1 /100 | #276 | Tragic 5.4% |
| Immigrants | Western Africa | 0.1 /100 | #277 | Tragic 5.4% |
| Colville | 0.1 /100 | #278 | Tragic 5.4% |
| Brazilians | 0.1 /100 | #279 | Tragic 5.5% |
| Immigrants | South America | 0.1 /100 | #280 | Tragic 5.5% |
| Immigrants | Norway | 0.0 /100 | #281 | Tragic 5.5% |
| Immigrants | Belize | 0.0 /100 | #282 | Tragic 5.5% |
| Immigrants | Haiti | 0.0 /100 | #283 | Tragic 5.5% |
| Immigrants | Liberia | 0.0 /100 | #284 | Tragic 5.5% |
| Central Americans | 0.0 /100 | #285 | Tragic 5.5% |
| Immigrants | Barbados | 0.0 /100 | #286 | Tragic 5.5% |
| Venezuelans | 0.0 /100 | #287 | Tragic 5.5% |
| U.S. Virgin Islanders | 0.0 /100 | #288 | Tragic 5.5% |
| Immigrants | Cabo Verde | 0.0 /100 | #289 | Tragic 5.5% |
| Jamaicans | 0.0 /100 | #290 | Tragic 5.5% |