New Zealander vs Immigrants from Canada Unemployment Among Seniors over 65 years
COMPARE
New Zealander
Immigrants from Canada
Unemployment Among Seniors over 65 years
Unemployment Among Seniors over 65 years Comparison
New Zealanders
Immigrants from Canada
5.1%
UNEMPLOYMENT AMONG SENIORS OVER 65 YEARS
83.2/ 100
METRIC RATING
138th/ 347
METRIC RANK
5.1%
UNEMPLOYMENT AMONG SENIORS OVER 65 YEARS
89.7/ 100
METRIC RATING
119th/ 347
METRIC RANK
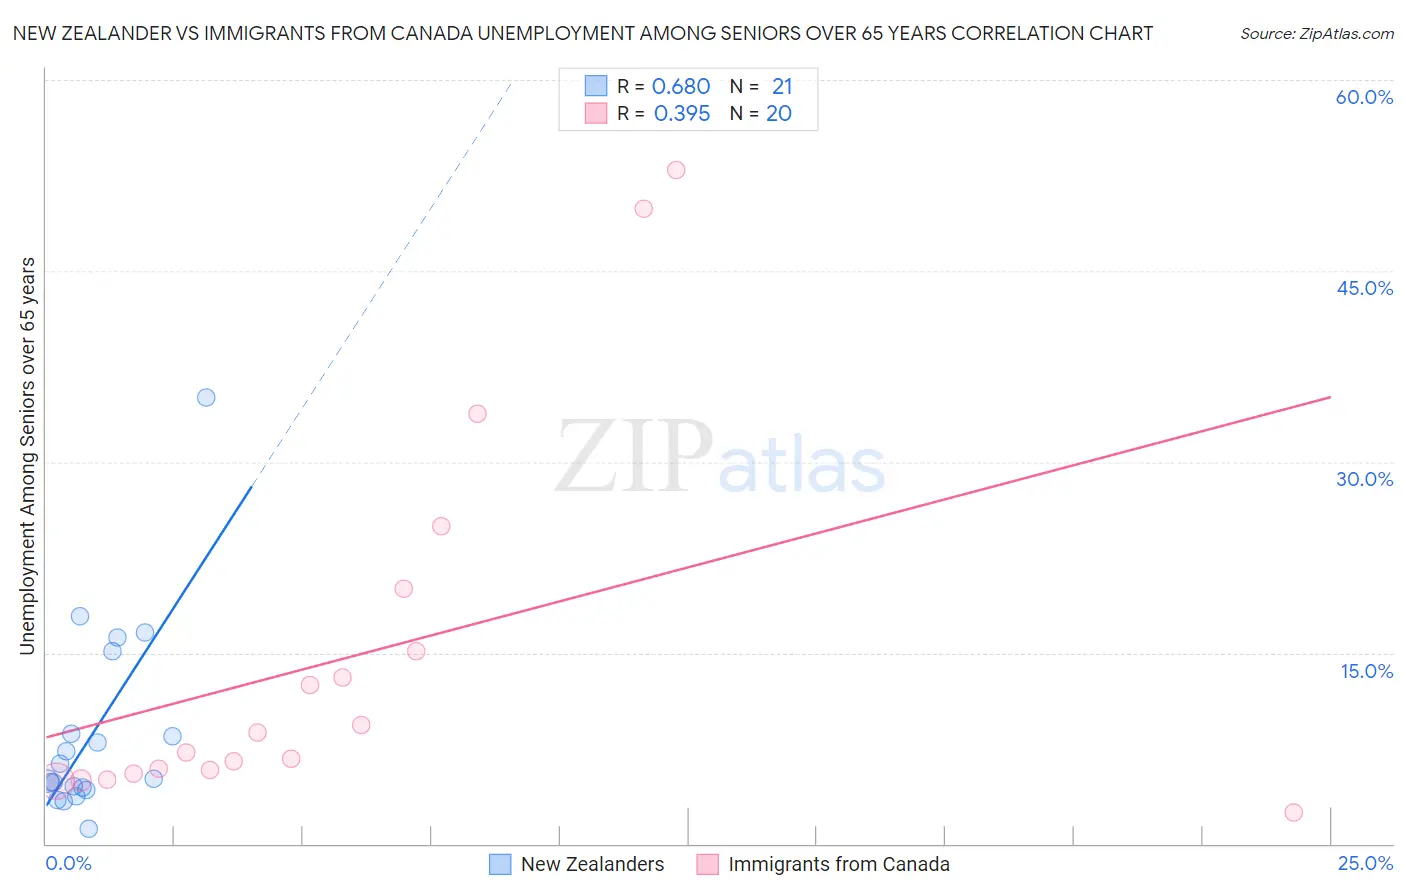
New Zealander vs Immigrants from Canada Unemployment Among Seniors over 65 years Correlation Chart
The statistical analysis conducted on geographies consisting of 103,565,974 people shows a significant positive correlation between the proportion of New Zealanders and unemployment rate amomg seniors over the age of 65 in the United States with a correlation coefficient (R) of 0.680 and weighted average of 5.1%. Similarly, the statistical analysis conducted on geographies consisting of 402,028,604 people shows a mild positive correlation between the proportion of Immigrants from Canada and unemployment rate amomg seniors over the age of 65 in the United States with a correlation coefficient (R) of 0.395 and weighted average of 5.1%, a difference of 0.46%.
Unemployment Among Seniors over 65 years Correlation Summary
| Measurement | New Zealander | Immigrants from Canada |
| Minimum | 1.2% | 2.5% |
| Maximum | 35.1% | 52.9% |
| Range | 33.9% | 50.4% |
| Mean | 8.8% | 14.8% |
| Median | 5.1% | 8.0% |
| Interquartile 25% (IQ1) | 4.3% | 5.7% |
| Interquartile 75% (IQ3) | 11.9% | 17.6% |
| Interquartile Range (IQR) | 7.5% | 11.9% |
| Standard Deviation (Sample) | 7.8% | 14.7% |
| Standard Deviation (Population) | 7.6% | 14.4% |
Demographics Similar to New Zealanders and Immigrants from Canada by Unemployment Among Seniors over 65 years
In terms of unemployment among seniors over 65 years, the demographic groups most similar to New Zealanders are Arab (5.1%, a difference of 0.060%), Ukrainian (5.1%, a difference of 0.070%), White/Caucasian (5.1%, a difference of 0.070%), Turkish (5.1%, a difference of 0.10%), and Syrian (5.1%, a difference of 0.12%). Similarly, the demographic groups most similar to Immigrants from Canada are Soviet Union (5.1%, a difference of 0.040%), Irish (5.1%, a difference of 0.080%), Puget Sound Salish (5.1%, a difference of 0.090%), Immigrants from Cameroon (5.1%, a difference of 0.090%), and Asian (5.1%, a difference of 0.10%).
| Demographics | Rating | Rank | Unemployment Among Seniors over 65 years |
| Soviet Union | 90.1 /100 | #118 | Exceptional 5.1% |
| Immigrants | Canada | 89.7 /100 | #119 | Excellent 5.1% |
| Irish | 88.8 /100 | #120 | Excellent 5.1% |
| Puget Sound Salish | 88.7 /100 | #121 | Excellent 5.1% |
| Immigrants | Cameroon | 88.6 /100 | #122 | Excellent 5.1% |
| Asians | 88.5 /100 | #123 | Excellent 5.1% |
| Immigrants | North America | 87.9 /100 | #124 | Excellent 5.1% |
| Dutch | 87.6 /100 | #125 | Excellent 5.1% |
| Immigrants | Sri Lanka | 87.4 /100 | #126 | Excellent 5.1% |
| Sri Lankans | 87.4 /100 | #127 | Excellent 5.1% |
| Australians | 87.1 /100 | #128 | Excellent 5.1% |
| Immigrants | England | 86.7 /100 | #129 | Excellent 5.1% |
| Iranians | 86.6 /100 | #130 | Excellent 5.1% |
| Immigrants | Australia | 85.8 /100 | #131 | Excellent 5.1% |
| Chileans | 85.6 /100 | #132 | Excellent 5.1% |
| Syrians | 85.3 /100 | #133 | Excellent 5.1% |
| Turks | 84.9 /100 | #134 | Excellent 5.1% |
| Ukrainians | 84.4 /100 | #135 | Excellent 5.1% |
| Whites/Caucasians | 84.4 /100 | #136 | Excellent 5.1% |
| Arabs | 84.3 /100 | #137 | Excellent 5.1% |
| New Zealanders | 83.2 /100 | #138 | Excellent 5.1% |