Native Hawaiian vs Immigrants from Hong Kong Unemployment Among Women with Children Under 6 years
COMPARE
Native Hawaiian
Immigrants from Hong Kong
Unemployment Among Women with Children Under 6 years
Unemployment Among Women with Children Under 6 years Comparison
Native Hawaiians
Immigrants from Hong Kong
8.2%
UNEMPLOYMENT AMONG WOMEN WITH CHILDREN UNDER 6 YEARS
1.7/ 100
METRIC RATING
245th/ 347
METRIC RANK
5.8%
UNEMPLOYMENT AMONG WOMEN WITH CHILDREN UNDER 6 YEARS
100.0/ 100
METRIC RATING
2nd/ 347
METRIC RANK
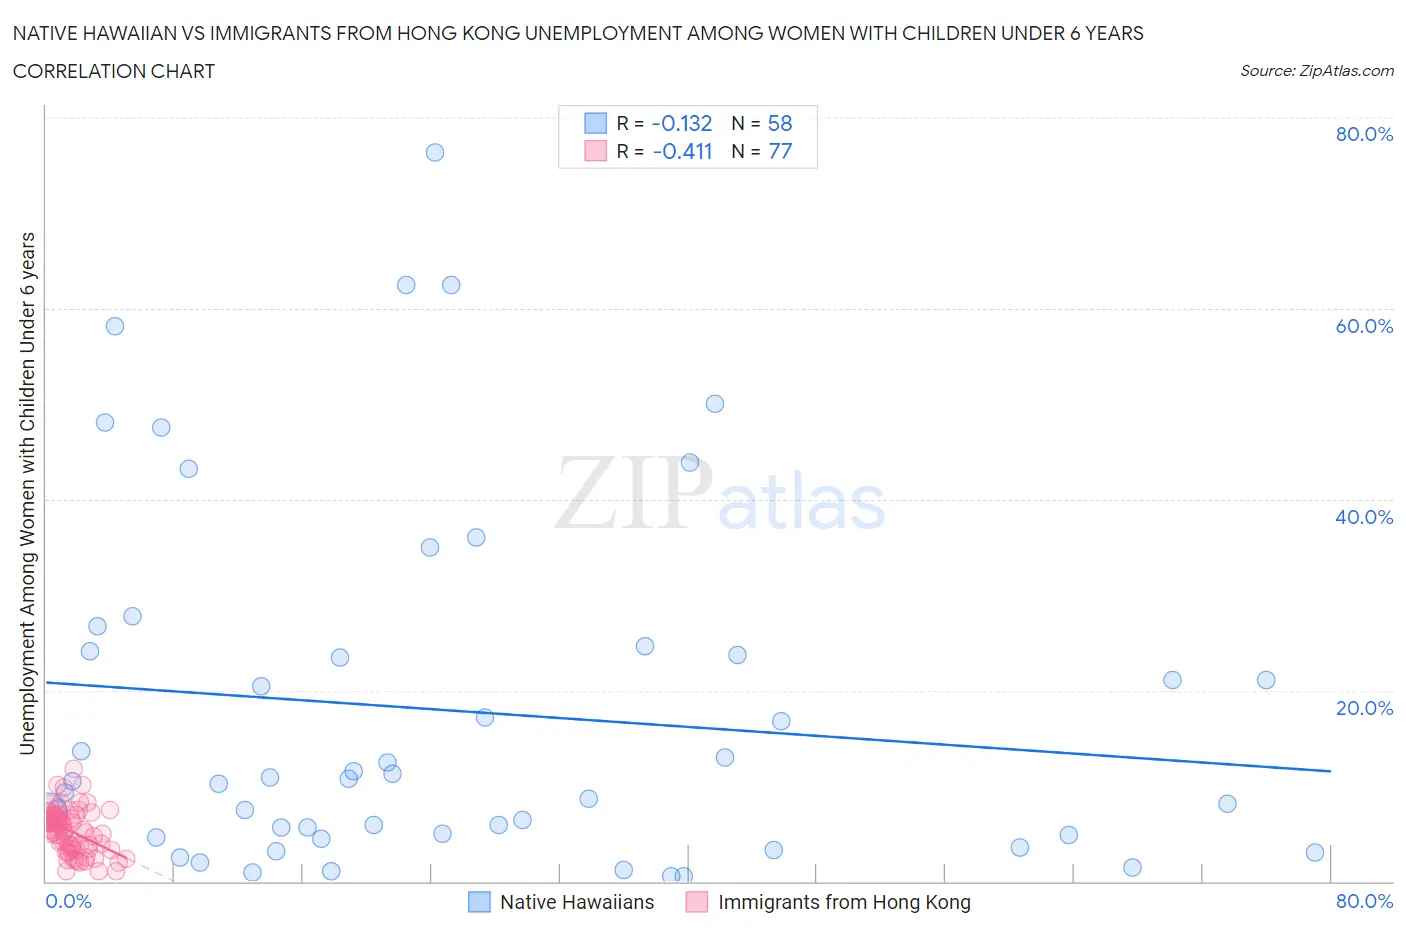
Native Hawaiian vs Immigrants from Hong Kong Unemployment Among Women with Children Under 6 years Correlation Chart
The statistical analysis conducted on geographies consisting of 264,079,731 people shows a poor negative correlation between the proportion of Native Hawaiians and unemployment rate among women with children under the age of 6 in the United States with a correlation coefficient (R) of -0.132 and weighted average of 8.2%. Similarly, the statistical analysis conducted on geographies consisting of 208,576,237 people shows a moderate negative correlation between the proportion of Immigrants from Hong Kong and unemployment rate among women with children under the age of 6 in the United States with a correlation coefficient (R) of -0.411 and weighted average of 5.8%, a difference of 41.0%.
Unemployment Among Women with Children Under 6 years Correlation Summary
| Measurement | Native Hawaiian | Immigrants from Hong Kong |
| Minimum | 0.50% | 1.0% |
| Maximum | 76.4% | 11.7% |
| Range | 75.9% | 10.7% |
| Mean | 17.8% | 5.2% |
| Median | 10.6% | 5.3% |
| Interquartile 25% (IQ1) | 4.8% | 3.4% |
| Interquartile 75% (IQ3) | 24.1% | 6.9% |
| Interquartile Range (IQR) | 19.3% | 3.5% |
| Standard Deviation (Sample) | 18.5% | 2.3% |
| Standard Deviation (Population) | 18.4% | 2.3% |
Similar Demographics by Unemployment Among Women with Children Under 6 years
Demographics Similar to Native Hawaiians by Unemployment Among Women with Children Under 6 years
In terms of unemployment among women with children under 6 years, the demographic groups most similar to Native Hawaiians are French (8.2%, a difference of 0.010%), Hawaiian (8.2%, a difference of 0.040%), Central American (8.2%, a difference of 0.33%), Dutch (8.1%, a difference of 0.59%), and German Russian (8.2%, a difference of 0.61%).
| Demographics | Rating | Rank | Unemployment Among Women with Children Under 6 years |
| Immigrants | Middle Africa | 3.2 /100 | #238 | Tragic 8.1% |
| Irish | 2.7 /100 | #239 | Tragic 8.1% |
| Immigrants | El Salvador | 2.6 /100 | #240 | Tragic 8.1% |
| Liberians | 2.6 /100 | #241 | Tragic 8.1% |
| Dutch | 2.5 /100 | #242 | Tragic 8.1% |
| Hawaiians | 1.8 /100 | #243 | Tragic 8.2% |
| French | 1.7 /100 | #244 | Tragic 8.2% |
| Native Hawaiians | 1.7 /100 | #245 | Tragic 8.2% |
| Central Americans | 1.4 /100 | #246 | Tragic 8.2% |
| German Russians | 1.2 /100 | #247 | Tragic 8.2% |
| Immigrants | Western Africa | 1.1 /100 | #248 | Tragic 8.2% |
| Immigrants | Sierra Leone | 1.1 /100 | #249 | Tragic 8.2% |
| Nigerians | 1.1 /100 | #250 | Tragic 8.2% |
| Guyanese | 1.0 /100 | #251 | Tragic 8.2% |
| Ghanaians | 1.0 /100 | #252 | Tragic 8.2% |
Demographics Similar to Immigrants from Hong Kong by Unemployment Among Women with Children Under 6 years
In terms of unemployment among women with children under 6 years, the demographic groups most similar to Immigrants from Hong Kong are Okinawan (5.8%, a difference of 0.87%), Cambodian (5.9%, a difference of 1.8%), Cape Verdean (5.9%, a difference of 2.8%), Immigrants from Taiwan (6.0%, a difference of 4.5%), and Taiwanese (6.1%, a difference of 5.1%).
| Demographics | Rating | Rank | Unemployment Among Women with Children Under 6 years |
| Immigrants | Cabo Verde | 100.0 /100 | #1 | Exceptional 5.4% |
| Immigrants | Hong Kong | 100.0 /100 | #2 | Exceptional 5.8% |
| Okinawans | 100.0 /100 | #3 | Exceptional 5.8% |
| Cambodians | 100.0 /100 | #4 | Exceptional 5.9% |
| Cape Verdeans | 100.0 /100 | #5 | Exceptional 5.9% |
| Immigrants | Taiwan | 100.0 /100 | #6 | Exceptional 6.0% |
| Taiwanese | 100.0 /100 | #7 | Exceptional 6.1% |
| Immigrants | India | 100.0 /100 | #8 | Exceptional 6.1% |
| Filipinos | 100.0 /100 | #9 | Exceptional 6.1% |
| Immigrants | China | 100.0 /100 | #10 | Exceptional 6.2% |
| Indians (Asian) | 100.0 /100 | #11 | Exceptional 6.3% |
| Immigrants | Singapore | 100.0 /100 | #12 | Exceptional 6.3% |
| Immigrants | Eastern Asia | 100.0 /100 | #13 | Exceptional 6.3% |
| Immigrants | Bulgaria | 100.0 /100 | #14 | Exceptional 6.3% |
| Thais | 100.0 /100 | #15 | Exceptional 6.3% |