Native Hawaiian vs Central American Unemployment Among Ages 16 to 19 years
COMPARE
Native Hawaiian
Central American
Unemployment Among Ages 16 to 19 years
Unemployment Among Ages 16 to 19 years Comparison
Native Hawaiians
Central Americans
18.3%
UNEMPLOYMENT AMONG AGES 16 TO 19 YEARS
2.4/ 100
METRIC RATING
239th/ 347
METRIC RANK
18.8%
UNEMPLOYMENT AMONG AGES 16 TO 19 YEARS
0.3/ 100
METRIC RATING
253rd/ 347
METRIC RANK
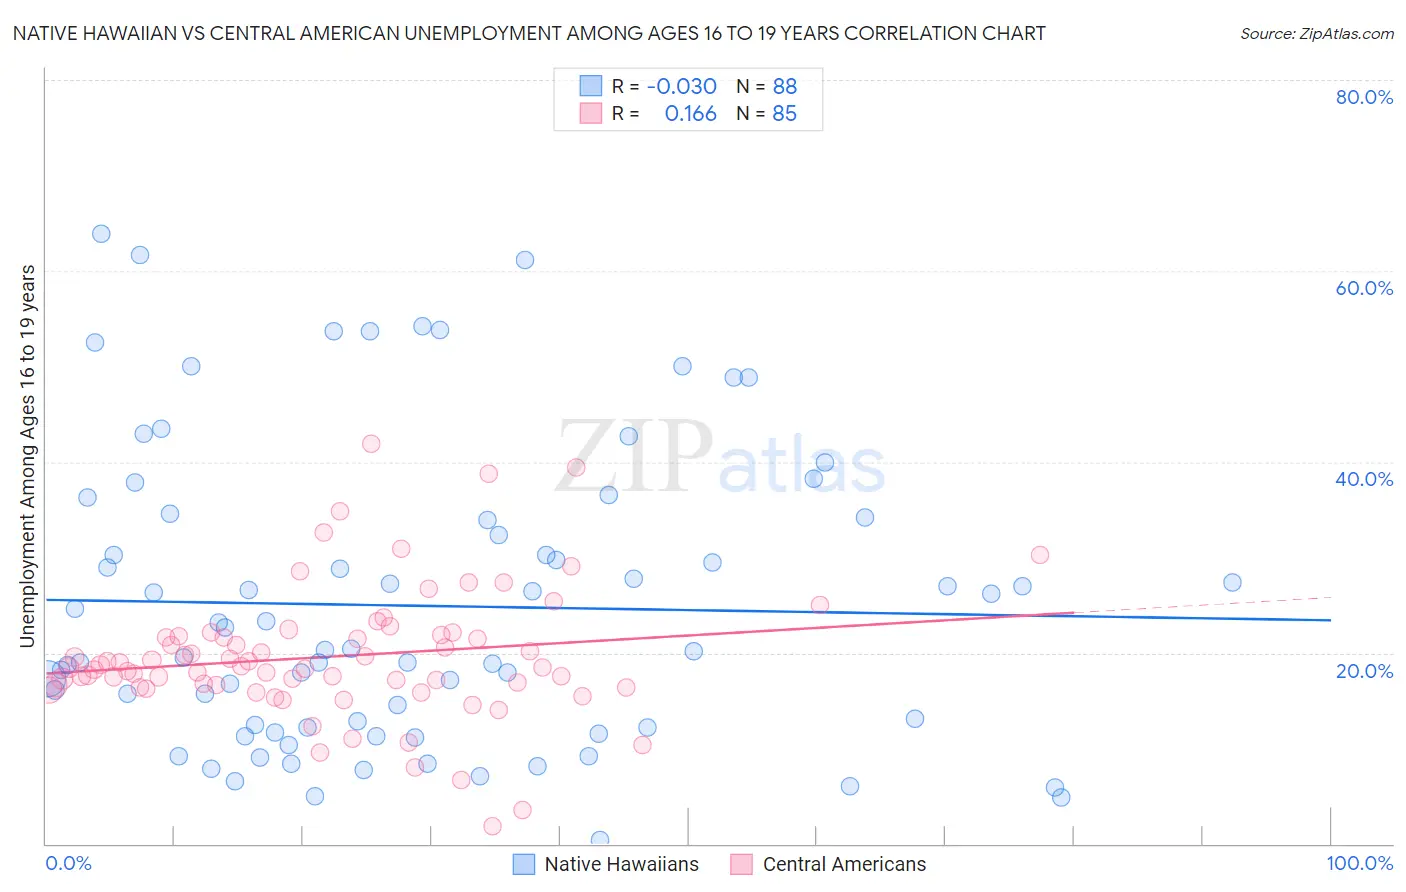
Native Hawaiian vs Central American Unemployment Among Ages 16 to 19 years Correlation Chart
The statistical analysis conducted on geographies consisting of 318,420,829 people shows no correlation between the proportion of Native Hawaiians and unemployment rate among population between the ages 16 and 19 in the United States with a correlation coefficient (R) of -0.030 and weighted average of 18.3%. Similarly, the statistical analysis conducted on geographies consisting of 468,892,359 people shows a poor positive correlation between the proportion of Central Americans and unemployment rate among population between the ages 16 and 19 in the United States with a correlation coefficient (R) of 0.166 and weighted average of 18.8%, a difference of 2.5%.
Unemployment Among Ages 16 to 19 years Correlation Summary
| Measurement | Native Hawaiian | Central American |
| Minimum | 0.40% | 1.8% |
| Maximum | 63.9% | 41.9% |
| Range | 63.5% | 40.1% |
| Mean | 24.9% | 19.6% |
| Median | 20.4% | 18.5% |
| Interquartile 25% (IQ1) | 12.2% | 16.5% |
| Interquartile 75% (IQ3) | 34.0% | 21.8% |
| Interquartile Range (IQR) | 21.8% | 5.3% |
| Standard Deviation (Sample) | 15.5% | 6.9% |
| Standard Deviation (Population) | 15.4% | 6.8% |
Demographics Similar to Native Hawaiians and Central Americans by Unemployment Among Ages 16 to 19 years
In terms of unemployment among ages 16 to 19 years, the demographic groups most similar to Native Hawaiians are South American (18.3%, a difference of 0.080%), Immigrants (18.3%, a difference of 0.10%), Immigrants from Colombia (18.3%, a difference of 0.11%), Immigrants from Cabo Verde (18.4%, a difference of 0.22%), and Immigrants from Ukraine (18.5%, a difference of 0.77%). Similarly, the demographic groups most similar to Central Americans are Apache (18.8%, a difference of 0.030%), Immigrants from Cameroon (18.8%, a difference of 0.040%), Mexican American Indian (18.8%, a difference of 0.11%), Immigrants from Guatemala (18.7%, a difference of 0.30%), and Subsaharan African (18.7%, a difference of 0.33%).
| Demographics | Rating | Rank | Unemployment Among Ages 16 to 19 years |
| Immigrants | Colombia | 2.7 /100 | #236 | Tragic 18.3% |
| Immigrants | Immigrants | 2.7 /100 | #237 | Tragic 18.3% |
| South Americans | 2.6 /100 | #238 | Tragic 18.3% |
| Native Hawaiians | 2.4 /100 | #239 | Tragic 18.3% |
| Immigrants | Cabo Verde | 2.0 /100 | #240 | Tragic 18.4% |
| Immigrants | Ukraine | 1.3 /100 | #241 | Tragic 18.5% |
| Moroccans | 1.1 /100 | #242 | Tragic 18.5% |
| Mexicans | 0.9 /100 | #243 | Tragic 18.5% |
| Guatemalans | 0.8 /100 | #244 | Tragic 18.6% |
| Immigrants | Belarus | 0.8 /100 | #245 | Tragic 18.6% |
| Immigrants | South America | 0.5 /100 | #246 | Tragic 18.7% |
| Immigrants | Israel | 0.5 /100 | #247 | Tragic 18.7% |
| Delaware | 0.5 /100 | #248 | Tragic 18.7% |
| Puget Sound Salish | 0.5 /100 | #249 | Tragic 18.7% |
| Panamanians | 0.4 /100 | #250 | Tragic 18.7% |
| Sub-Saharan Africans | 0.4 /100 | #251 | Tragic 18.7% |
| Immigrants | Guatemala | 0.4 /100 | #252 | Tragic 18.7% |
| Central Americans | 0.3 /100 | #253 | Tragic 18.8% |
| Apache | 0.3 /100 | #254 | Tragic 18.8% |
| Immigrants | Cameroon | 0.3 /100 | #255 | Tragic 18.8% |
| Mexican American Indians | 0.3 /100 | #256 | Tragic 18.8% |