Immigrants from North America vs Central American Unemployment Among Ages 16 to 19 years
COMPARE
Immigrants from North America
Central American
Unemployment Among Ages 16 to 19 years
Unemployment Among Ages 16 to 19 years Comparison
Immigrants from North America
Central Americans
16.8%
UNEMPLOYMENT AMONG AGES 16 TO 19 YEARS
97.9/ 100
METRIC RATING
76th/ 347
METRIC RANK
18.8%
UNEMPLOYMENT AMONG AGES 16 TO 19 YEARS
0.3/ 100
METRIC RATING
253rd/ 347
METRIC RANK
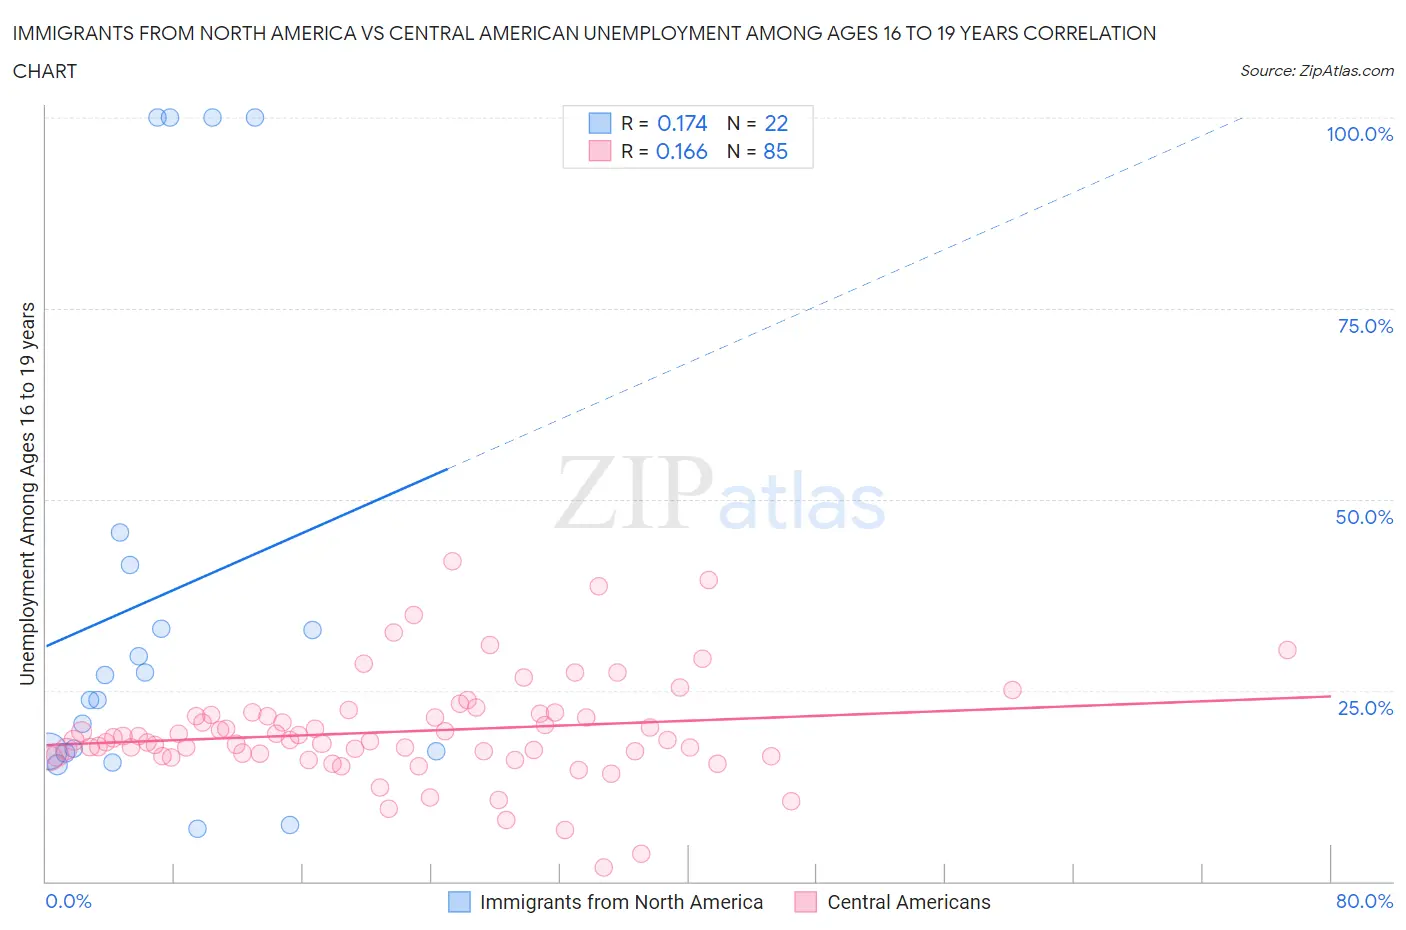
Immigrants from North America vs Central American Unemployment Among Ages 16 to 19 years Correlation Chart
The statistical analysis conducted on geographies consisting of 431,170,215 people shows a poor positive correlation between the proportion of Immigrants from North America and unemployment rate among population between the ages 16 and 19 in the United States with a correlation coefficient (R) of 0.174 and weighted average of 16.8%. Similarly, the statistical analysis conducted on geographies consisting of 468,892,359 people shows a poor positive correlation between the proportion of Central Americans and unemployment rate among population between the ages 16 and 19 in the United States with a correlation coefficient (R) of 0.166 and weighted average of 18.8%, a difference of 12.0%.
Unemployment Among Ages 16 to 19 years Correlation Summary
| Measurement | Immigrants from North America | Central American |
| Minimum | 6.9% | 1.8% |
| Maximum | 100.0% | 41.9% |
| Range | 93.1% | 40.1% |
| Mean | 37.2% | 19.6% |
| Median | 25.4% | 18.5% |
| Interquartile 25% (IQ1) | 17.0% | 16.5% |
| Interquartile 75% (IQ3) | 41.4% | 21.8% |
| Interquartile Range (IQR) | 24.4% | 5.3% |
| Standard Deviation (Sample) | 31.8% | 6.9% |
| Standard Deviation (Population) | 31.0% | 6.8% |
Similar Demographics by Unemployment Among Ages 16 to 19 years
Demographics Similar to Immigrants from North America by Unemployment Among Ages 16 to 19 years
In terms of unemployment among ages 16 to 19 years, the demographic groups most similar to Immigrants from North America are New Zealander (16.8%, a difference of 0.070%), Immigrants from Singapore (16.8%, a difference of 0.070%), Soviet Union (16.8%, a difference of 0.090%), Immigrants from Eastern Africa (16.8%, a difference of 0.13%), and Lithuanian (16.7%, a difference of 0.16%).
| Demographics | Rating | Rank | Unemployment Among Ages 16 to 19 years |
| Serbians | 98.7 /100 | #69 | Exceptional 16.7% |
| Austrians | 98.6 /100 | #70 | Exceptional 16.7% |
| Latvians | 98.5 /100 | #71 | Exceptional 16.7% |
| Immigrants | Canada | 98.5 /100 | #72 | Exceptional 16.7% |
| Lithuanians | 98.2 /100 | #73 | Exceptional 16.7% |
| Immigrants | Eastern Africa | 98.1 /100 | #74 | Exceptional 16.8% |
| New Zealanders | 98.0 /100 | #75 | Exceptional 16.8% |
| Immigrants | North America | 97.9 /100 | #76 | Exceptional 16.8% |
| Immigrants | Singapore | 97.8 /100 | #77 | Exceptional 16.8% |
| Soviet Union | 97.8 /100 | #78 | Exceptional 16.8% |
| Slovaks | 97.5 /100 | #79 | Exceptional 16.8% |
| French Canadians | 97.5 /100 | #80 | Exceptional 16.8% |
| Immigrants | Latvia | 97.5 /100 | #81 | Exceptional 16.8% |
| Whites/Caucasians | 97.5 /100 | #82 | Exceptional 16.8% |
| Ugandans | 97.4 /100 | #83 | Exceptional 16.8% |
Demographics Similar to Central Americans by Unemployment Among Ages 16 to 19 years
In terms of unemployment among ages 16 to 19 years, the demographic groups most similar to Central Americans are Apache (18.8%, a difference of 0.030%), Immigrants from Cameroon (18.8%, a difference of 0.040%), Mexican American Indian (18.8%, a difference of 0.11%), Immigrants from Guatemala (18.7%, a difference of 0.30%), and Subsaharan African (18.7%, a difference of 0.33%).
| Demographics | Rating | Rank | Unemployment Among Ages 16 to 19 years |
| Immigrants | South America | 0.5 /100 | #246 | Tragic 18.7% |
| Immigrants | Israel | 0.5 /100 | #247 | Tragic 18.7% |
| Delaware | 0.5 /100 | #248 | Tragic 18.7% |
| Puget Sound Salish | 0.5 /100 | #249 | Tragic 18.7% |
| Panamanians | 0.4 /100 | #250 | Tragic 18.7% |
| Sub-Saharan Africans | 0.4 /100 | #251 | Tragic 18.7% |
| Immigrants | Guatemala | 0.4 /100 | #252 | Tragic 18.7% |
| Central Americans | 0.3 /100 | #253 | Tragic 18.8% |
| Apache | 0.3 /100 | #254 | Tragic 18.8% |
| Immigrants | Cameroon | 0.3 /100 | #255 | Tragic 18.8% |
| Mexican American Indians | 0.3 /100 | #256 | Tragic 18.8% |
| Immigrants | Nigeria | 0.2 /100 | #257 | Tragic 18.9% |
| Immigrants | Mexico | 0.2 /100 | #258 | Tragic 18.9% |
| Immigrants | Central America | 0.2 /100 | #259 | Tragic 18.9% |
| Nigerians | 0.2 /100 | #260 | Tragic 18.9% |