Menominee vs Danish Unemployment Among Ages 65 to 74 years
COMPARE
Menominee
Danish
Unemployment Among Ages 65 to 74 years
Unemployment Among Ages 65 to 74 years Comparison
Menominee
Danes
4.8%
UNEMPLOYMENT AMONG AGES 65 TO 74 YEARS
100.0/ 100
METRIC RATING
19th/ 347
METRIC RANK
5.2%
UNEMPLOYMENT AMONG AGES 65 TO 74 YEARS
97.9/ 100
METRIC RATING
86th/ 347
METRIC RANK
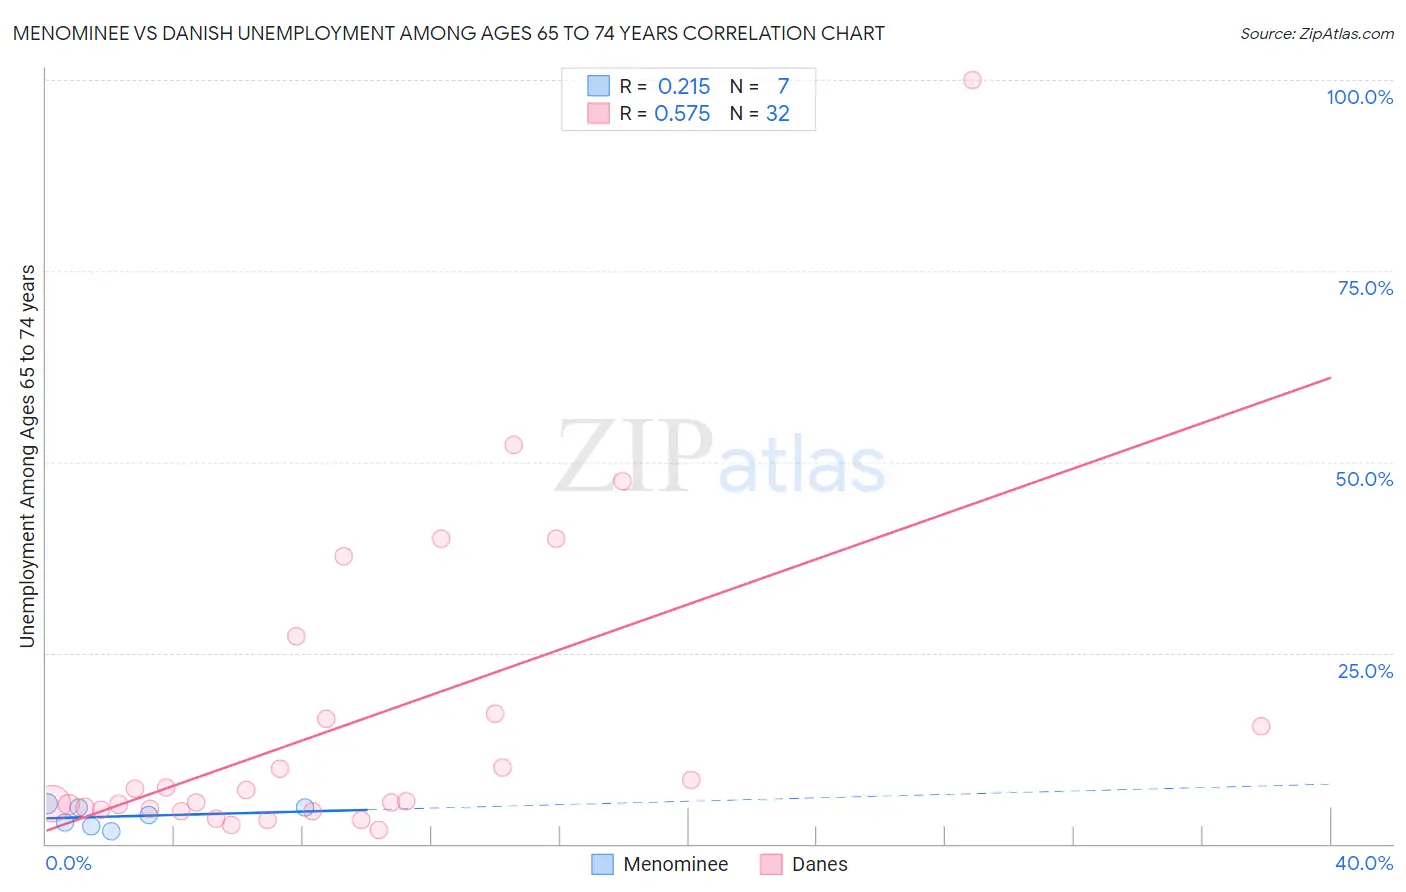
Menominee vs Danish Unemployment Among Ages 65 to 74 years Correlation Chart
The statistical analysis conducted on geographies consisting of 43,411,389 people shows a weak positive correlation between the proportion of Menominee and unemployment rate among population between the ages 65 and 74 in the United States with a correlation coefficient (R) of 0.215 and weighted average of 4.8%. Similarly, the statistical analysis conducted on geographies consisting of 394,234,615 people shows a substantial positive correlation between the proportion of Danes and unemployment rate among population between the ages 65 and 74 in the United States with a correlation coefficient (R) of 0.575 and weighted average of 5.2%, a difference of 7.6%.
Unemployment Among Ages 65 to 74 years Correlation Summary
| Measurement | Menominee | Danish |
| Minimum | 1.6% | 1.8% |
| Maximum | 5.2% | 100.0% |
| Range | 3.6% | 98.2% |
| Mean | 3.6% | 16.0% |
| Median | 3.7% | 6.3% |
| Interquartile 25% (IQ1) | 2.2% | 4.5% |
| Interquartile 75% (IQ3) | 4.8% | 16.7% |
| Interquartile Range (IQR) | 2.6% | 12.2% |
| Standard Deviation (Sample) | 1.4% | 21.0% |
| Standard Deviation (Population) | 1.3% | 20.7% |
Similar Demographics by Unemployment Among Ages 65 to 74 years
Demographics Similar to Menominee by Unemployment Among Ages 65 to 74 years
In terms of unemployment among ages 65 to 74 years, the demographic groups most similar to Menominee are Creek (4.8%, a difference of 0.050%), Kenyan (4.8%, a difference of 0.12%), Immigrants from Burma/Myanmar (4.8%, a difference of 0.14%), Immigrants from Zaire (4.8%, a difference of 0.26%), and Immigrants from North Macedonia (4.8%, a difference of 0.43%).
| Demographics | Rating | Rank | Unemployment Among Ages 65 to 74 years |
| Tongans | 100.0 /100 | #12 | Exceptional 4.7% |
| Lumbee | 100.0 /100 | #13 | Exceptional 4.8% |
| Cubans | 100.0 /100 | #14 | Exceptional 4.8% |
| Immigrants | North Macedonia | 100.0 /100 | #15 | Exceptional 4.8% |
| Immigrants | Burma/Myanmar | 100.0 /100 | #16 | Exceptional 4.8% |
| Kenyans | 100.0 /100 | #17 | Exceptional 4.8% |
| Creek | 100.0 /100 | #18 | Exceptional 4.8% |
| Menominee | 100.0 /100 | #19 | Exceptional 4.8% |
| Immigrants | Zaire | 100.0 /100 | #20 | Exceptional 4.8% |
| Immigrants | Eritrea | 100.0 /100 | #21 | Exceptional 4.9% |
| Lebanese | 100.0 /100 | #22 | Exceptional 4.9% |
| Immigrants | Nepal | 100.0 /100 | #23 | Exceptional 4.9% |
| Iraqis | 100.0 /100 | #24 | Exceptional 4.9% |
| Macedonians | 100.0 /100 | #25 | Exceptional 5.0% |
| Czechs | 100.0 /100 | #26 | Exceptional 5.0% |
Demographics Similar to Danes by Unemployment Among Ages 65 to 74 years
In terms of unemployment among ages 65 to 74 years, the demographic groups most similar to Danes are Scottish (5.2%, a difference of 0.0%), British (5.2%, a difference of 0.010%), Immigrants from Saudi Arabia (5.2%, a difference of 0.020%), English (5.2%, a difference of 0.020%), and Immigrants from Hungary (5.2%, a difference of 0.040%).
| Demographics | Rating | Rank | Unemployment Among Ages 65 to 74 years |
| Slavs | 98.7 /100 | #79 | Exceptional 5.2% |
| Immigrants | South Africa | 98.6 /100 | #80 | Exceptional 5.2% |
| Immigrants | Scotland | 98.6 /100 | #81 | Exceptional 5.2% |
| Thais | 98.6 /100 | #82 | Exceptional 5.2% |
| Immigrants | Middle Africa | 98.4 /100 | #83 | Exceptional 5.2% |
| Immigrants | Hungary | 98.0 /100 | #84 | Exceptional 5.2% |
| British | 97.9 /100 | #85 | Exceptional 5.2% |
| Danes | 97.9 /100 | #86 | Exceptional 5.2% |
| Scottish | 97.9 /100 | #87 | Exceptional 5.2% |
| Immigrants | Saudi Arabia | 97.9 /100 | #88 | Exceptional 5.2% |
| English | 97.8 /100 | #89 | Exceptional 5.2% |
| Luxembourgers | 97.6 /100 | #90 | Exceptional 5.2% |
| Romanians | 97.4 /100 | #91 | Exceptional 5.2% |
| Puget Sound Salish | 97.3 /100 | #92 | Exceptional 5.2% |
| Immigrants | Netherlands | 97.1 /100 | #93 | Exceptional 5.2% |