Iranian vs Danish Unemployment Among Ages 65 to 74 years
COMPARE
Iranian
Danish
Unemployment Among Ages 65 to 74 years
Unemployment Among Ages 65 to 74 years Comparison
Iranians
Danes
5.2%
UNEMPLOYMENT AMONG AGES 65 TO 74 YEARS
95.2/ 100
METRIC RATING
105th/ 347
METRIC RANK
5.2%
UNEMPLOYMENT AMONG AGES 65 TO 74 YEARS
97.9/ 100
METRIC RATING
86th/ 347
METRIC RANK
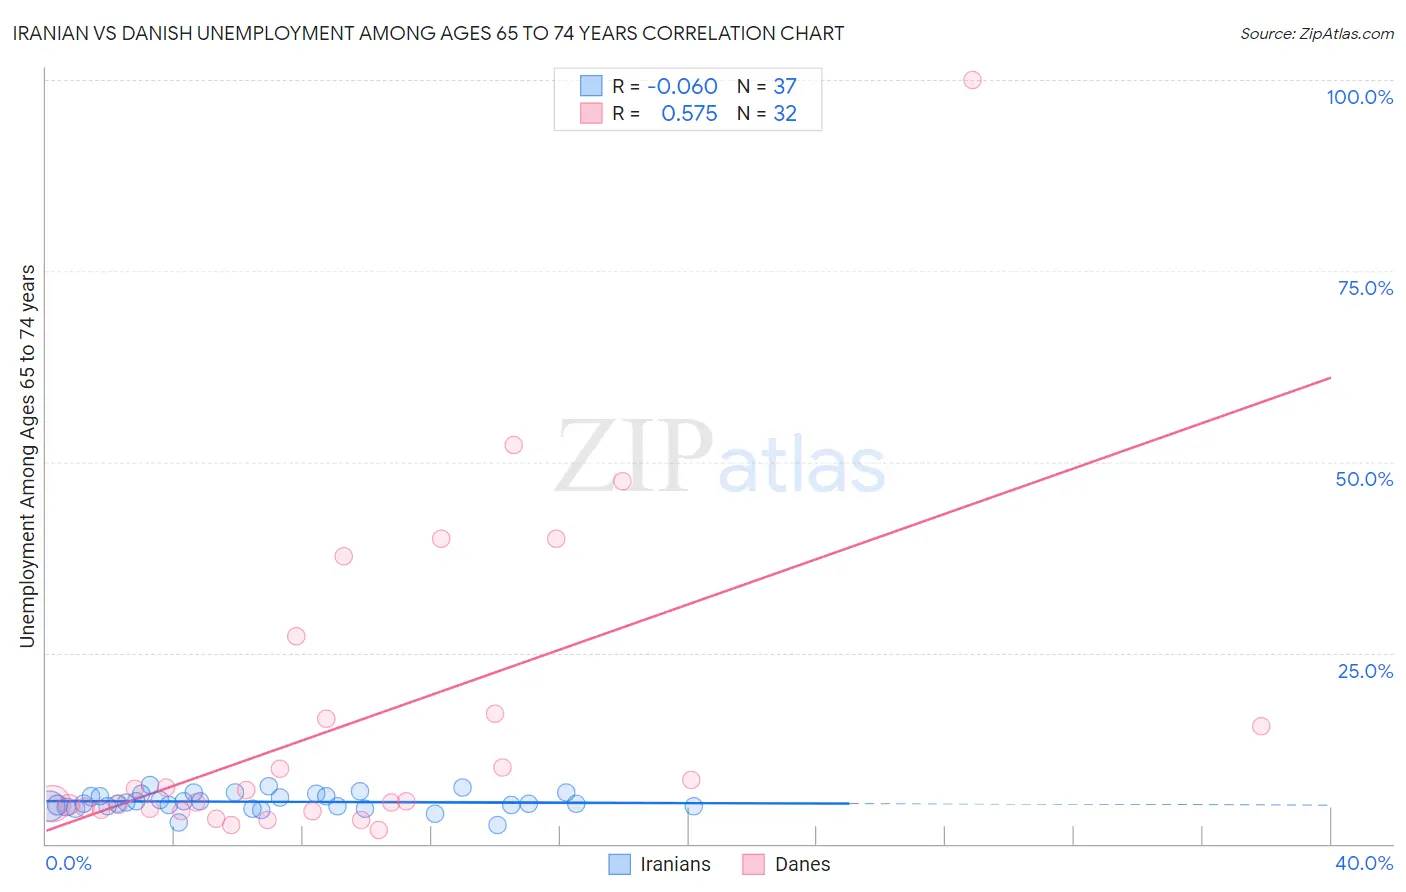
Iranian vs Danish Unemployment Among Ages 65 to 74 years Correlation Chart
The statistical analysis conducted on geographies consisting of 288,873,217 people shows a slight negative correlation between the proportion of Iranians and unemployment rate among population between the ages 65 and 74 in the United States with a correlation coefficient (R) of -0.060 and weighted average of 5.2%. Similarly, the statistical analysis conducted on geographies consisting of 394,234,615 people shows a substantial positive correlation between the proportion of Danes and unemployment rate among population between the ages 65 and 74 in the United States with a correlation coefficient (R) of 0.575 and weighted average of 5.2%, a difference of 0.73%.
Unemployment Among Ages 65 to 74 years Correlation Summary
| Measurement | Iranian | Danish |
| Minimum | 2.4% | 1.8% |
| Maximum | 7.6% | 100.0% |
| Range | 5.2% | 98.2% |
| Mean | 5.5% | 16.0% |
| Median | 5.3% | 6.3% |
| Interquartile 25% (IQ1) | 4.9% | 4.5% |
| Interquartile 75% (IQ3) | 6.4% | 16.7% |
| Interquartile Range (IQR) | 1.5% | 12.2% |
| Standard Deviation (Sample) | 1.2% | 21.0% |
| Standard Deviation (Population) | 1.1% | 20.7% |
Demographics Similar to Iranians and Danes by Unemployment Among Ages 65 to 74 years
In terms of unemployment among ages 65 to 74 years, the demographic groups most similar to Iranians are Yugoslavian (5.2%, a difference of 0.050%), Immigrants from Vietnam (5.2%, a difference of 0.070%), Immigrants from Lithuania (5.2%, a difference of 0.14%), Japanese (5.2%, a difference of 0.24%), and Immigrants from Cambodia (5.2%, a difference of 0.24%). Similarly, the demographic groups most similar to Danes are Scottish (5.2%, a difference of 0.0%), British (5.2%, a difference of 0.010%), Immigrants from Saudi Arabia (5.2%, a difference of 0.020%), English (5.2%, a difference of 0.020%), and Luxembourger (5.2%, a difference of 0.11%).
| Demographics | Rating | Rank | Unemployment Among Ages 65 to 74 years |
| British | 97.9 /100 | #85 | Exceptional 5.2% |
| Danes | 97.9 /100 | #86 | Exceptional 5.2% |
| Scottish | 97.9 /100 | #87 | Exceptional 5.2% |
| Immigrants | Saudi Arabia | 97.9 /100 | #88 | Exceptional 5.2% |
| English | 97.8 /100 | #89 | Exceptional 5.2% |
| Luxembourgers | 97.6 /100 | #90 | Exceptional 5.2% |
| Romanians | 97.4 /100 | #91 | Exceptional 5.2% |
| Puget Sound Salish | 97.3 /100 | #92 | Exceptional 5.2% |
| Immigrants | Netherlands | 97.1 /100 | #93 | Exceptional 5.2% |
| South Africans | 97.1 /100 | #94 | Exceptional 5.2% |
| Serbians | 97.0 /100 | #95 | Exceptional 5.2% |
| Immigrants | Thailand | 97.0 /100 | #96 | Exceptional 5.2% |
| Senegalese | 96.5 /100 | #97 | Exceptional 5.2% |
| Welsh | 96.5 /100 | #98 | Exceptional 5.2% |
| Burmese | 96.4 /100 | #99 | Exceptional 5.2% |
| Japanese | 96.4 /100 | #100 | Exceptional 5.2% |
| Immigrants | Cambodia | 96.3 /100 | #101 | Exceptional 5.2% |
| Immigrants | Lithuania | 95.9 /100 | #102 | Exceptional 5.2% |
| Immigrants | Vietnam | 95.6 /100 | #103 | Exceptional 5.2% |
| Yugoslavians | 95.5 /100 | #104 | Exceptional 5.2% |
| Iranians | 95.2 /100 | #105 | Exceptional 5.2% |