Lumbee vs Immigrants from Uzbekistan Unemployment Among Women with Children Ages 6 to 17 years
COMPARE
Lumbee
Immigrants from Uzbekistan
Unemployment Among Women with Children Ages 6 to 17 years
Unemployment Among Women with Children Ages 6 to 17 years Comparison
Lumbee
Immigrants from Uzbekistan
9.3%
UNEMPLOYMENT AMONG WOMEN WITH CHILDREN AGES 6 TO 17 YEARS
4.3/ 100
METRIC RATING
229th/ 347
METRIC RANK
7.8%
UNEMPLOYMENT AMONG WOMEN WITH CHILDREN AGES 6 TO 17 YEARS
100.0/ 100
METRIC RATING
28th/ 347
METRIC RANK
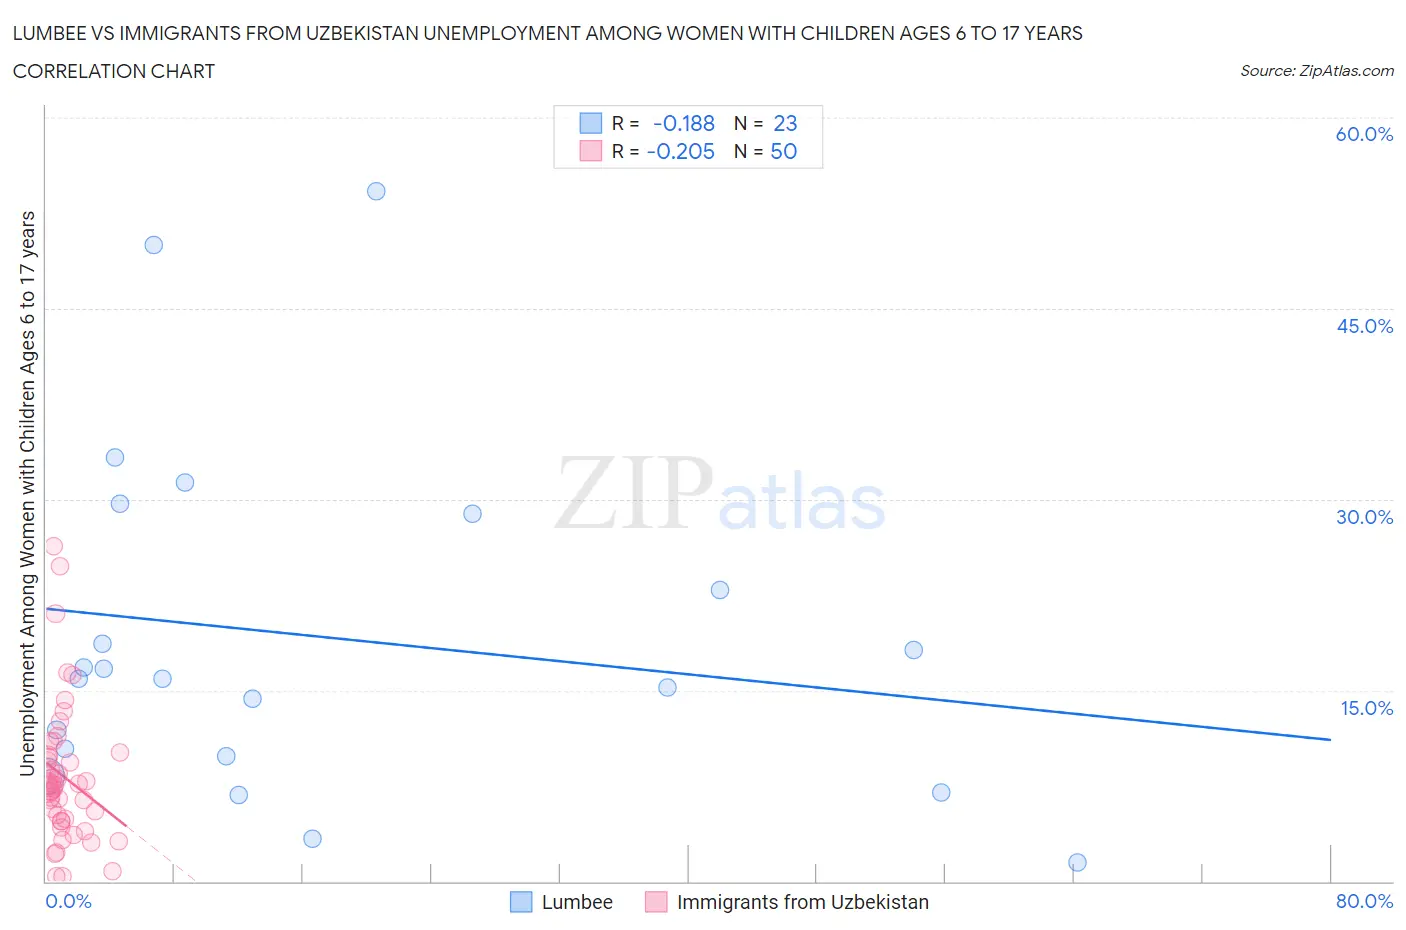
Lumbee vs Immigrants from Uzbekistan Unemployment Among Women with Children Ages 6 to 17 years Correlation Chart
The statistical analysis conducted on geographies consisting of 80,540,946 people shows a poor negative correlation between the proportion of Lumbee and unemployment rate among women with children between the ages 6 and 17 in the United States with a correlation coefficient (R) of -0.188 and weighted average of 9.3%. Similarly, the statistical analysis conducted on geographies consisting of 101,911,425 people shows a weak negative correlation between the proportion of Immigrants from Uzbekistan and unemployment rate among women with children between the ages 6 and 17 in the United States with a correlation coefficient (R) of -0.205 and weighted average of 7.8%, a difference of 18.9%.
Unemployment Among Women with Children Ages 6 to 17 years Correlation Summary
| Measurement | Lumbee | Immigrants from Uzbekistan |
| Minimum | 1.5% | 0.40% |
| Maximum | 54.2% | 26.3% |
| Range | 52.7% | 25.9% |
| Mean | 19.2% | 8.2% |
| Median | 15.9% | 7.4% |
| Interquartile 25% (IQ1) | 9.8% | 4.7% |
| Interquartile 75% (IQ3) | 28.9% | 9.9% |
| Interquartile Range (IQR) | 19.1% | 5.2% |
| Standard Deviation (Sample) | 13.5% | 5.5% |
| Standard Deviation (Population) | 13.2% | 5.4% |
Similar Demographics by Unemployment Among Women with Children Ages 6 to 17 years
Demographics Similar to Lumbee by Unemployment Among Women with Children Ages 6 to 17 years
In terms of unemployment among women with children ages 6 to 17 years, the demographic groups most similar to Lumbee are Estonian (9.3%, a difference of 0.030%), Panamanian (9.3%, a difference of 0.060%), Immigrants from the Azores (9.3%, a difference of 0.080%), Welsh (9.3%, a difference of 0.090%), and Macedonian (9.3%, a difference of 0.10%).
| Demographics | Rating | Rank | Unemployment Among Women with Children Ages 6 to 17 years |
| Immigrants | Southern Europe | 5.8 /100 | #222 | Tragic 9.2% |
| Immigrants | Eritrea | 5.8 /100 | #223 | Tragic 9.2% |
| Immigrants | El Salvador | 5.3 /100 | #224 | Tragic 9.3% |
| Chinese | 5.2 /100 | #225 | Tragic 9.3% |
| Immigrants | Azores | 4.6 /100 | #226 | Tragic 9.3% |
| Panamanians | 4.5 /100 | #227 | Tragic 9.3% |
| Estonians | 4.4 /100 | #228 | Tragic 9.3% |
| Lumbee | 4.3 /100 | #229 | Tragic 9.3% |
| Welsh | 4.0 /100 | #230 | Tragic 9.3% |
| Macedonians | 3.9 /100 | #231 | Tragic 9.3% |
| French American Indians | 3.7 /100 | #232 | Tragic 9.3% |
| Immigrants | St. Vincent and the Grenadines | 3.3 /100 | #233 | Tragic 9.3% |
| Mexicans | 3.2 /100 | #234 | Tragic 9.3% |
| Uruguayans | 3.0 /100 | #235 | Tragic 9.3% |
| Hungarians | 3.0 /100 | #236 | Tragic 9.3% |
Demographics Similar to Immigrants from Uzbekistan by Unemployment Among Women with Children Ages 6 to 17 years
In terms of unemployment among women with children ages 6 to 17 years, the demographic groups most similar to Immigrants from Uzbekistan are Immigrants from Afghanistan (7.8%, a difference of 0.33%), Thai (7.8%, a difference of 0.34%), Immigrants from Eastern Asia (7.7%, a difference of 0.96%), Indian (Asian) (7.7%, a difference of 0.96%), and Nepalese (7.7%, a difference of 1.1%).
| Demographics | Rating | Rank | Unemployment Among Women with Children Ages 6 to 17 years |
| Immigrants | India | 100.0 /100 | #21 | Exceptional 7.7% |
| Immigrants | China | 100.0 /100 | #22 | Exceptional 7.7% |
| Immigrants | Indonesia | 100.0 /100 | #23 | Exceptional 7.7% |
| Nepalese | 100.0 /100 | #24 | Exceptional 7.7% |
| Immigrants | Eastern Asia | 100.0 /100 | #25 | Exceptional 7.7% |
| Indians (Asian) | 100.0 /100 | #26 | Exceptional 7.7% |
| Immigrants | Afghanistan | 100.0 /100 | #27 | Exceptional 7.8% |
| Immigrants | Uzbekistan | 100.0 /100 | #28 | Exceptional 7.8% |
| Thais | 100.0 /100 | #29 | Exceptional 7.8% |
| Immigrants | Iran | 100.0 /100 | #30 | Exceptional 7.9% |
| Laotians | 100.0 /100 | #31 | Exceptional 7.9% |
| Immigrants | Cambodia | 100.0 /100 | #32 | Exceptional 7.9% |
| Immigrants | Korea | 100.0 /100 | #33 | Exceptional 7.9% |
| Native Hawaiians | 100.0 /100 | #34 | Exceptional 7.9% |
| Immigrants | South Central Asia | 100.0 /100 | #35 | Exceptional 7.9% |