Lithuanian vs Immigrants from Venezuela Unemployment Among Ages 20 to 24 years
COMPARE
Lithuanian
Immigrants from Venezuela
Unemployment Among Ages 20 to 24 years
Unemployment Among Ages 20 to 24 years Comparison
Lithuanians
Immigrants from Venezuela
10.2%
UNEMPLOYMENT AMONG AGES 20 TO 24 YEARS
70.0/ 100
METRIC RATING
155th/ 347
METRIC RANK
8.9%
UNEMPLOYMENT AMONG AGES 20 TO 24 YEARS
100.0/ 100
METRIC RATING
2nd/ 347
METRIC RANK
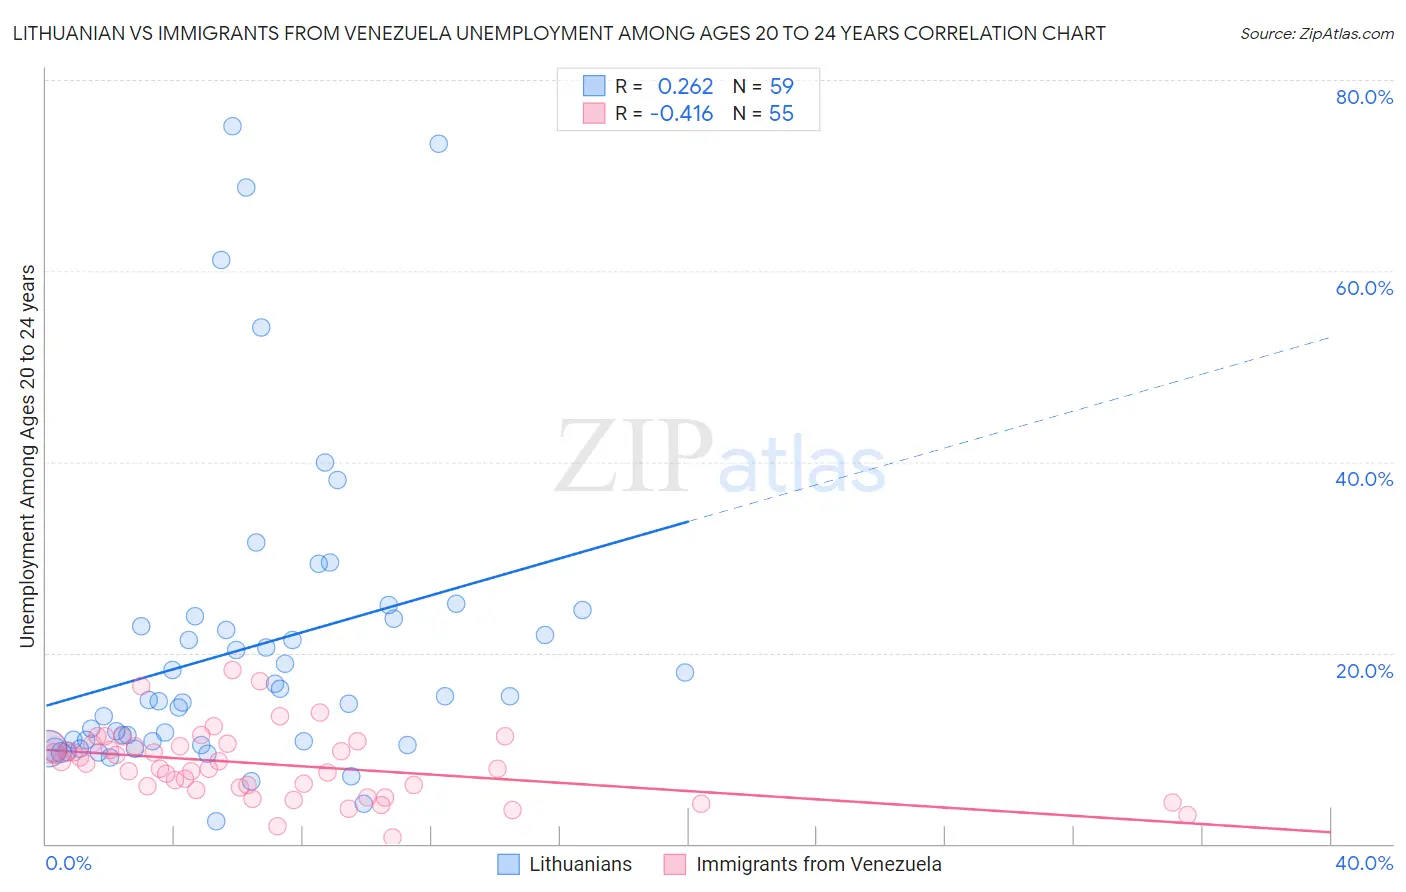
Lithuanian vs Immigrants from Venezuela Unemployment Among Ages 20 to 24 years Correlation Chart
The statistical analysis conducted on geographies consisting of 403,694,949 people shows a weak positive correlation between the proportion of Lithuanians and unemployment rate among population between the ages 20 and 24 in the United States with a correlation coefficient (R) of 0.262 and weighted average of 10.2%. Similarly, the statistical analysis conducted on geographies consisting of 282,850,918 people shows a moderate negative correlation between the proportion of Immigrants from Venezuela and unemployment rate among population between the ages 20 and 24 in the United States with a correlation coefficient (R) of -0.416 and weighted average of 8.9%, a difference of 14.9%.
Unemployment Among Ages 20 to 24 years Correlation Summary
| Measurement | Lithuanian | Immigrants from Venezuela |
| Minimum | 2.4% | 0.60% |
| Maximum | 75.2% | 18.2% |
| Range | 72.8% | 17.6% |
| Mean | 20.5% | 8.3% |
| Median | 15.0% | 8.4% |
| Interquartile 25% (IQ1) | 10.3% | 5.9% |
| Interquartile 75% (IQ3) | 23.5% | 10.5% |
| Interquartile Range (IQR) | 13.2% | 4.5% |
| Standard Deviation (Sample) | 16.2% | 3.6% |
| Standard Deviation (Population) | 16.1% | 3.6% |
Similar Demographics by Unemployment Among Ages 20 to 24 years
Demographics Similar to Lithuanians by Unemployment Among Ages 20 to 24 years
In terms of unemployment among ages 20 to 24 years, the demographic groups most similar to Lithuanians are Immigrants from Taiwan (10.2%, a difference of 0.060%), Immigrants from Switzerland (10.2%, a difference of 0.060%), Iranian (10.2%, a difference of 0.11%), Canadian (10.2%, a difference of 0.14%), and Immigrants from South Africa (10.2%, a difference of 0.17%).
| Demographics | Rating | Rank | Unemployment Among Ages 20 to 24 years |
| Immigrants | Romania | 75.7 /100 | #148 | Good 10.2% |
| Immigrants | Scotland | 74.6 /100 | #149 | Good 10.2% |
| Hungarians | 74.4 /100 | #150 | Good 10.2% |
| Immigrants | South Africa | 73.6 /100 | #151 | Good 10.2% |
| Iranians | 72.4 /100 | #152 | Good 10.2% |
| Immigrants | Taiwan | 71.4 /100 | #153 | Good 10.2% |
| Immigrants | Switzerland | 71.3 /100 | #154 | Good 10.2% |
| Lithuanians | 70.0 /100 | #155 | Good 10.2% |
| Canadians | 66.7 /100 | #156 | Good 10.2% |
| Immigrants | Uganda | 65.6 /100 | #157 | Good 10.2% |
| Immigrants | Kazakhstan | 65.5 /100 | #158 | Good 10.2% |
| Immigrants | England | 63.7 /100 | #159 | Good 10.3% |
| Spaniards | 63.4 /100 | #160 | Good 10.3% |
| Indians (Asian) | 62.6 /100 | #161 | Good 10.3% |
| Immigrants | Asia | 61.3 /100 | #162 | Good 10.3% |
Demographics Similar to Immigrants from Venezuela by Unemployment Among Ages 20 to 24 years
In terms of unemployment among ages 20 to 24 years, the demographic groups most similar to Immigrants from Venezuela are Indonesian (9.0%, a difference of 1.0%), Venezuelan (9.0%, a difference of 1.3%), Norwegian (9.0%, a difference of 1.5%), Immigrants from Burma/Myanmar (9.1%, a difference of 2.1%), and Luxembourger (9.1%, a difference of 2.5%).
| Demographics | Rating | Rank | Unemployment Among Ages 20 to 24 years |
| Immigrants | Cuba | 100.0 /100 | #1 | Exceptional 8.7% |
| Immigrants | Venezuela | 100.0 /100 | #2 | Exceptional 8.9% |
| Indonesians | 100.0 /100 | #3 | Exceptional 9.0% |
| Venezuelans | 100.0 /100 | #4 | Exceptional 9.0% |
| Norwegians | 100.0 /100 | #5 | Exceptional 9.0% |
| Immigrants | Burma/Myanmar | 100.0 /100 | #6 | Exceptional 9.1% |
| Luxembourgers | 100.0 /100 | #7 | Exceptional 9.1% |
| Somalis | 100.0 /100 | #8 | Exceptional 9.1% |
| Immigrants | Somalia | 100.0 /100 | #9 | Exceptional 9.2% |
| Sudanese | 100.0 /100 | #10 | Exceptional 9.2% |
| Zimbabweans | 100.0 /100 | #11 | Exceptional 9.2% |
| Cubans | 100.0 /100 | #12 | Exceptional 9.2% |
| Immigrants | Congo | 100.0 /100 | #13 | Exceptional 9.2% |
| Slovenes | 100.0 /100 | #14 | Exceptional 9.3% |
| Immigrants | Sudan | 100.0 /100 | #15 | Exceptional 9.3% |