Colville vs Immigrants from Venezuela Unemployment Among Ages 20 to 24 years
COMPARE
Colville
Immigrants from Venezuela
Unemployment Among Ages 20 to 24 years
Unemployment Among Ages 20 to 24 years Comparison
Colville
Immigrants from Venezuela
11.6%
UNEMPLOYMENT AMONG AGES 20 TO 24 YEARS
0.0/ 100
METRIC RATING
278th/ 347
METRIC RANK
8.9%
UNEMPLOYMENT AMONG AGES 20 TO 24 YEARS
100.0/ 100
METRIC RATING
2nd/ 347
METRIC RANK
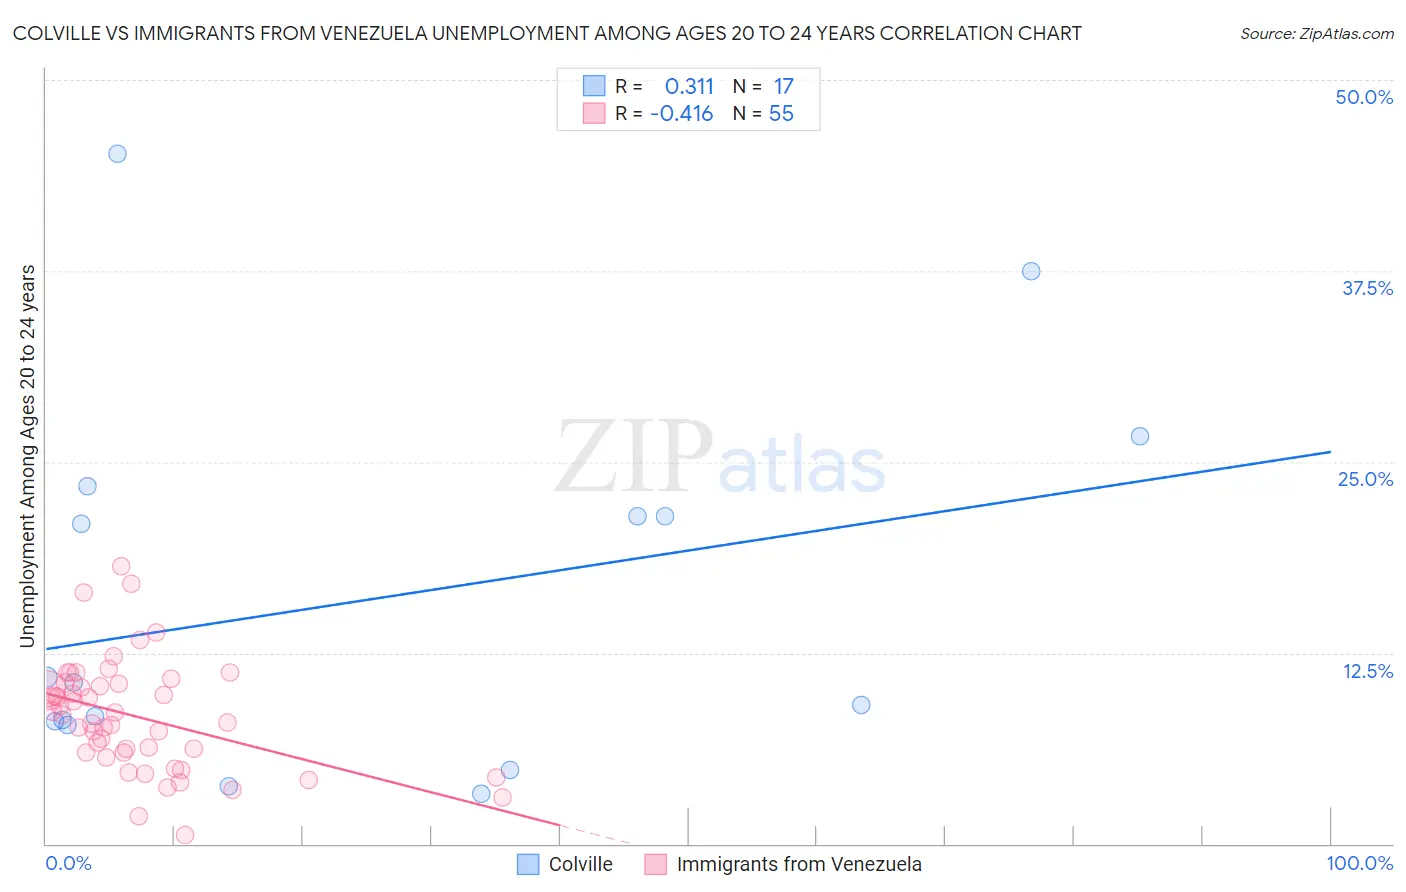
Colville vs Immigrants from Venezuela Unemployment Among Ages 20 to 24 years Correlation Chart
The statistical analysis conducted on geographies consisting of 34,530,623 people shows a mild positive correlation between the proportion of Colville and unemployment rate among population between the ages 20 and 24 in the United States with a correlation coefficient (R) of 0.311 and weighted average of 11.6%. Similarly, the statistical analysis conducted on geographies consisting of 282,850,918 people shows a moderate negative correlation between the proportion of Immigrants from Venezuela and unemployment rate among population between the ages 20 and 24 in the United States with a correlation coefficient (R) of -0.416 and weighted average of 8.9%, a difference of 29.8%.
Unemployment Among Ages 20 to 24 years Correlation Summary
| Measurement | Colville | Immigrants from Venezuela |
| Minimum | 3.3% | 0.60% |
| Maximum | 45.2% | 18.2% |
| Range | 41.9% | 17.6% |
| Mean | 16.0% | 8.3% |
| Median | 10.6% | 8.4% |
| Interquartile 25% (IQ1) | 7.9% | 5.9% |
| Interquartile 75% (IQ3) | 22.4% | 10.5% |
| Interquartile Range (IQR) | 14.5% | 4.5% |
| Standard Deviation (Sample) | 12.1% | 3.6% |
| Standard Deviation (Population) | 11.8% | 3.6% |
Similar Demographics by Unemployment Among Ages 20 to 24 years
Demographics Similar to Colville by Unemployment Among Ages 20 to 24 years
In terms of unemployment among ages 20 to 24 years, the demographic groups most similar to Colville are African (11.5%, a difference of 0.030%), Sierra Leonean (11.5%, a difference of 0.17%), Senegalese (11.5%, a difference of 0.22%), Bahamian (11.6%, a difference of 0.25%), and Cape Verdean (11.5%, a difference of 0.57%).
| Demographics | Rating | Rank | Unemployment Among Ages 20 to 24 years |
| Immigrants | Uzbekistan | 0.0 /100 | #271 | Tragic 11.4% |
| Nigerians | 0.0 /100 | #272 | Tragic 11.4% |
| Immigrants | Nigeria | 0.0 /100 | #273 | Tragic 11.5% |
| Cape Verdeans | 0.0 /100 | #274 | Tragic 11.5% |
| Senegalese | 0.0 /100 | #275 | Tragic 11.5% |
| Sierra Leoneans | 0.0 /100 | #276 | Tragic 11.5% |
| Africans | 0.0 /100 | #277 | Tragic 11.5% |
| Colville | 0.0 /100 | #278 | Tragic 11.6% |
| Bahamians | 0.0 /100 | #279 | Tragic 11.6% |
| Alaskan Athabascans | 0.0 /100 | #280 | Tragic 11.6% |
| Armenians | 0.0 /100 | #281 | Tragic 11.7% |
| Immigrants | Cameroon | 0.0 /100 | #282 | Tragic 11.7% |
| Ghanaians | 0.0 /100 | #283 | Tragic 11.7% |
| Immigrants | Western Africa | 0.0 /100 | #284 | Tragic 11.7% |
| Soviet Union | 0.0 /100 | #285 | Tragic 11.7% |
Demographics Similar to Immigrants from Venezuela by Unemployment Among Ages 20 to 24 years
In terms of unemployment among ages 20 to 24 years, the demographic groups most similar to Immigrants from Venezuela are Indonesian (9.0%, a difference of 1.0%), Venezuelan (9.0%, a difference of 1.3%), Norwegian (9.0%, a difference of 1.5%), Immigrants from Burma/Myanmar (9.1%, a difference of 2.1%), and Luxembourger (9.1%, a difference of 2.5%).
| Demographics | Rating | Rank | Unemployment Among Ages 20 to 24 years |
| Immigrants | Cuba | 100.0 /100 | #1 | Exceptional 8.7% |
| Immigrants | Venezuela | 100.0 /100 | #2 | Exceptional 8.9% |
| Indonesians | 100.0 /100 | #3 | Exceptional 9.0% |
| Venezuelans | 100.0 /100 | #4 | Exceptional 9.0% |
| Norwegians | 100.0 /100 | #5 | Exceptional 9.0% |
| Immigrants | Burma/Myanmar | 100.0 /100 | #6 | Exceptional 9.1% |
| Luxembourgers | 100.0 /100 | #7 | Exceptional 9.1% |
| Somalis | 100.0 /100 | #8 | Exceptional 9.1% |
| Immigrants | Somalia | 100.0 /100 | #9 | Exceptional 9.2% |
| Sudanese | 100.0 /100 | #10 | Exceptional 9.2% |
| Zimbabweans | 100.0 /100 | #11 | Exceptional 9.2% |
| Cubans | 100.0 /100 | #12 | Exceptional 9.2% |
| Immigrants | Congo | 100.0 /100 | #13 | Exceptional 9.2% |
| Slovenes | 100.0 /100 | #14 | Exceptional 9.3% |
| Immigrants | Sudan | 100.0 /100 | #15 | Exceptional 9.3% |