Lithuanian vs Immigrants from Indonesia Unemployment Among Ages 55 to 59 years
COMPARE
Lithuanian
Immigrants from Indonesia
Unemployment Among Ages 55 to 59 years
Unemployment Among Ages 55 to 59 years Comparison
Lithuanians
Immigrants from Indonesia
4.7%
UNEMPLOYMENT AMONG AGES 55 TO 59 YEARS
88.8/ 100
METRIC RATING
124th/ 347
METRIC RANK
4.8%
UNEMPLOYMENT AMONG AGES 55 TO 59 YEARS
80.2/ 100
METRIC RATING
140th/ 347
METRIC RANK
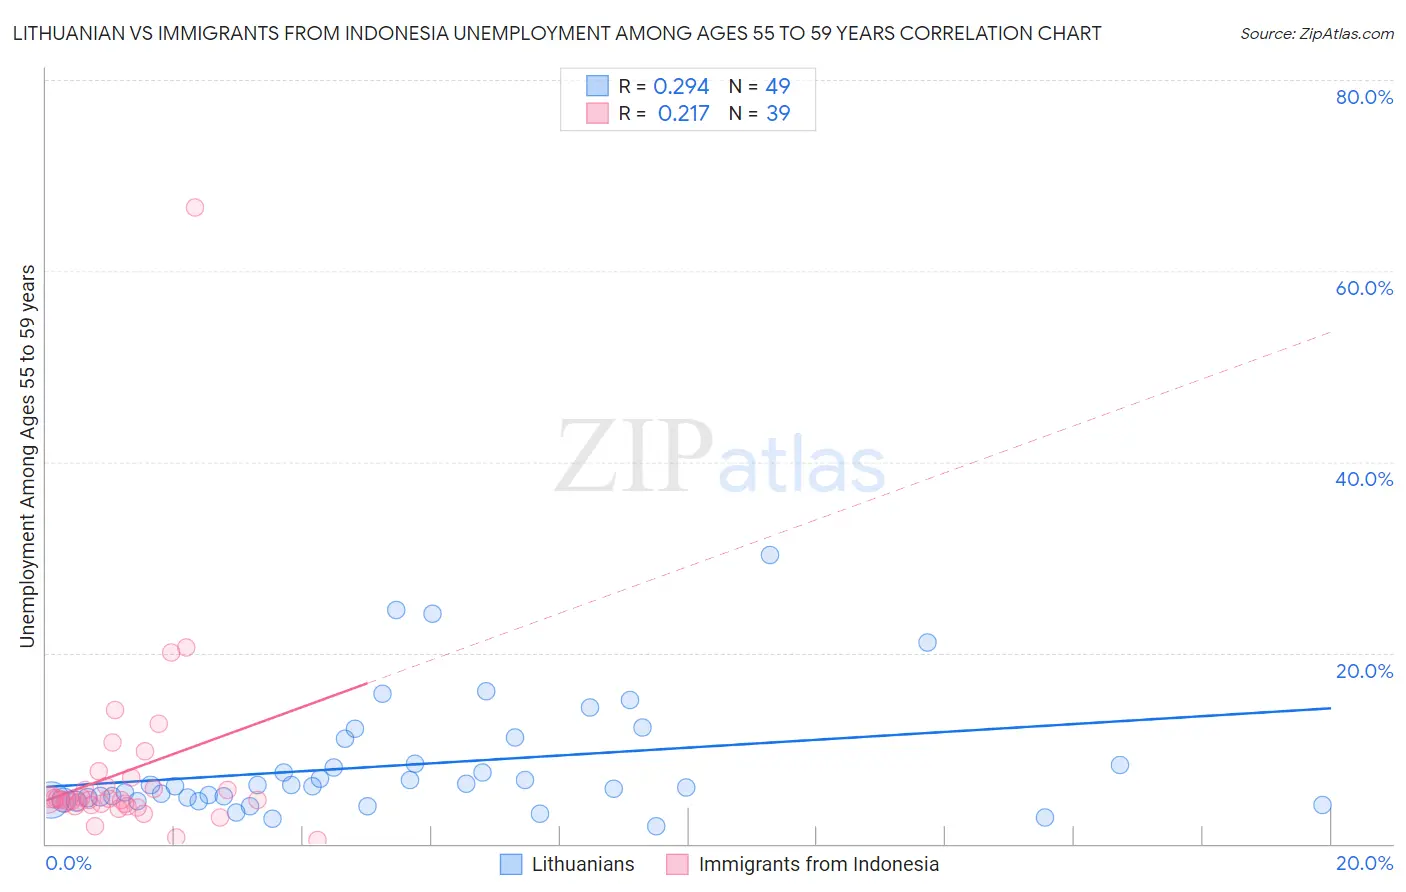
Lithuanian vs Immigrants from Indonesia Unemployment Among Ages 55 to 59 years Correlation Chart
The statistical analysis conducted on geographies consisting of 386,833,182 people shows a weak positive correlation between the proportion of Lithuanians and unemployment rate among population between the ages 55 and 59 in the United States with a correlation coefficient (R) of 0.294 and weighted average of 4.7%. Similarly, the statistical analysis conducted on geographies consisting of 208,661,080 people shows a weak positive correlation between the proportion of Immigrants from Indonesia and unemployment rate among population between the ages 55 and 59 in the United States with a correlation coefficient (R) of 0.217 and weighted average of 4.8%, a difference of 0.70%.
Unemployment Among Ages 55 to 59 years Correlation Summary
| Measurement | Lithuanian | Immigrants from Indonesia |
| Minimum | 1.8% | 0.40% |
| Maximum | 30.2% | 66.7% |
| Range | 28.4% | 66.3% |
| Mean | 8.2% | 7.5% |
| Median | 6.0% | 4.6% |
| Interquartile 25% (IQ1) | 4.6% | 4.1% |
| Interquartile 75% (IQ3) | 9.7% | 6.0% |
| Interquartile Range (IQR) | 5.1% | 1.9% |
| Standard Deviation (Sample) | 6.1% | 10.6% |
| Standard Deviation (Population) | 6.1% | 10.5% |
Demographics Similar to Lithuanians and Immigrants from Indonesia by Unemployment Among Ages 55 to 59 years
In terms of unemployment among ages 55 to 59 years, the demographic groups most similar to Lithuanians are Immigrants from Japan (4.7%, a difference of 0.060%), Immigrants from Afghanistan (4.7%, a difference of 0.070%), Immigrants from Malaysia (4.7%, a difference of 0.10%), Immigrants from Serbia (4.7%, a difference of 0.11%), and Icelander (4.7%, a difference of 0.12%). Similarly, the demographic groups most similar to Immigrants from Indonesia are French Canadian (4.8%, a difference of 0.010%), Immigrants from Norway (4.8%, a difference of 0.030%), Romanian (4.7%, a difference of 0.17%), Immigrants from Switzerland (4.7%, a difference of 0.19%), and Delaware (4.7%, a difference of 0.23%).
| Demographics | Rating | Rank | Unemployment Among Ages 55 to 59 years |
| Immigrants | Afghanistan | 89.5 /100 | #122 | Excellent 4.7% |
| Immigrants | Japan | 89.4 /100 | #123 | Excellent 4.7% |
| Lithuanians | 88.8 /100 | #124 | Excellent 4.7% |
| Immigrants | Malaysia | 87.9 /100 | #125 | Excellent 4.7% |
| Immigrants | Serbia | 87.8 /100 | #126 | Excellent 4.7% |
| Icelanders | 87.7 /100 | #127 | Excellent 4.7% |
| Pennsylvania Germans | 87.1 /100 | #128 | Excellent 4.7% |
| Immigrants | Sweden | 86.8 /100 | #129 | Excellent 4.7% |
| Greeks | 86.6 /100 | #130 | Excellent 4.7% |
| Immigrants | Thailand | 85.4 /100 | #131 | Excellent 4.7% |
| Immigrants | Romania | 85.3 /100 | #132 | Excellent 4.7% |
| Immigrants | Netherlands | 84.5 /100 | #133 | Excellent 4.7% |
| Panamanians | 84.1 /100 | #134 | Excellent 4.7% |
| Slavs | 83.7 /100 | #135 | Excellent 4.7% |
| Colombians | 83.6 /100 | #136 | Excellent 4.7% |
| Delaware | 83.6 /100 | #137 | Excellent 4.7% |
| Immigrants | Switzerland | 82.9 /100 | #138 | Excellent 4.7% |
| Romanians | 82.7 /100 | #139 | Excellent 4.7% |
| Immigrants | Indonesia | 80.2 /100 | #140 | Excellent 4.8% |
| French Canadians | 80.1 /100 | #141 | Excellent 4.8% |
| Immigrants | Norway | 79.8 /100 | #142 | Good 4.8% |