Kiowa vs Ute Unemployment Among Ages 35 to 44 years
COMPARE
Kiowa
Ute
Unemployment Among Ages 35 to 44 years
Unemployment Among Ages 35 to 44 years Comparison
Kiowa
Ute
5.1%
UNEMPLOYMENT AMONG AGES 35 TO 44 YEARS
0.8/ 100
METRIC RATING
237th/ 347
METRIC RANK
5.3%
UNEMPLOYMENT AMONG AGES 35 TO 44 YEARS
0.0/ 100
METRIC RATING
271st/ 347
METRIC RANK
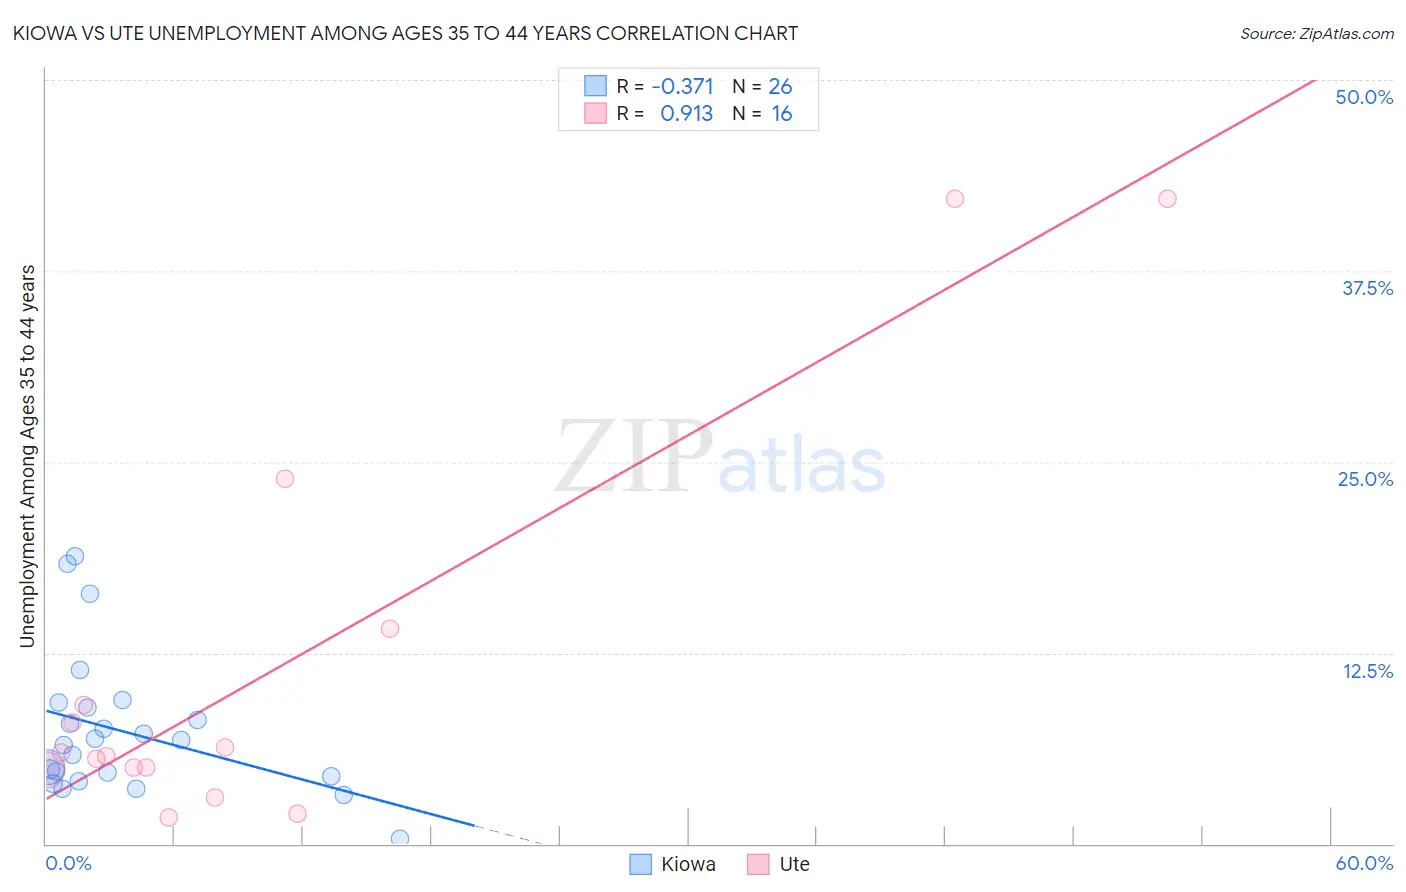
Kiowa vs Ute Unemployment Among Ages 35 to 44 years Correlation Chart
The statistical analysis conducted on geographies consisting of 55,787,842 people shows a mild negative correlation between the proportion of Kiowa and unemployment rate among population between the ages 35 and 44 in the United States with a correlation coefficient (R) of -0.371 and weighted average of 5.1%. Similarly, the statistical analysis conducted on geographies consisting of 55,228,645 people shows a near-perfect positive correlation between the proportion of Ute and unemployment rate among population between the ages 35 and 44 in the United States with a correlation coefficient (R) of 0.913 and weighted average of 5.3%, a difference of 5.1%.
Unemployment Among Ages 35 to 44 years Correlation Summary
| Measurement | Kiowa | Ute |
| Minimum | 0.30% | 1.7% |
| Maximum | 18.8% | 42.2% |
| Range | 18.5% | 40.5% |
| Mean | 7.4% | 11.5% |
| Median | 6.7% | 5.8% |
| Interquartile 25% (IQ1) | 4.4% | 4.9% |
| Interquartile 75% (IQ3) | 8.9% | 11.6% |
| Interquartile Range (IQR) | 4.5% | 6.7% |
| Standard Deviation (Sample) | 4.5% | 13.1% |
| Standard Deviation (Population) | 4.5% | 12.7% |
Similar Demographics by Unemployment Among Ages 35 to 44 years
Demographics Similar to Kiowa by Unemployment Among Ages 35 to 44 years
In terms of unemployment among ages 35 to 44 years, the demographic groups most similar to Kiowa are Central American (5.1%, a difference of 0.050%), Honduran (5.1%, a difference of 0.17%), Nigerian (5.1%, a difference of 0.23%), Guamanian/Chamorro (5.1%, a difference of 0.26%), and Somali (5.1%, a difference of 0.36%).
| Demographics | Rating | Rank | Unemployment Among Ages 35 to 44 years |
| Liberians | 1.3 /100 | #230 | Tragic 5.1% |
| Japanese | 1.2 /100 | #231 | Tragic 5.1% |
| Iroquois | 1.2 /100 | #232 | Tragic 5.1% |
| Immigrants | Nigeria | 1.2 /100 | #233 | Tragic 5.1% |
| Portuguese | 1.1 /100 | #234 | Tragic 5.1% |
| Guamanians/Chamorros | 0.9 /100 | #235 | Tragic 5.1% |
| Central Americans | 0.8 /100 | #236 | Tragic 5.1% |
| Kiowa | 0.8 /100 | #237 | Tragic 5.1% |
| Hondurans | 0.7 /100 | #238 | Tragic 5.1% |
| Nigerians | 0.7 /100 | #239 | Tragic 5.1% |
| Somalis | 0.7 /100 | #240 | Tragic 5.1% |
| Immigrants | Honduras | 0.6 /100 | #241 | Tragic 5.1% |
| Delaware | 0.5 /100 | #242 | Tragic 5.1% |
| Salvadorans | 0.4 /100 | #243 | Tragic 5.1% |
| Guatemalans | 0.4 /100 | #244 | Tragic 5.1% |
Demographics Similar to Ute by Unemployment Among Ages 35 to 44 years
In terms of unemployment among ages 35 to 44 years, the demographic groups most similar to Ute are Senegalese (5.3%, a difference of 0.010%), Blackfeet (5.3%, a difference of 0.17%), Vietnamese (5.4%, a difference of 0.19%), Creek (5.4%, a difference of 0.24%), and Cajun (5.3%, a difference of 0.31%).
| Demographics | Rating | Rank | Unemployment Among Ages 35 to 44 years |
| Ghanaians | 0.1 /100 | #264 | Tragic 5.3% |
| Yaqui | 0.1 /100 | #265 | Tragic 5.3% |
| Immigrants | Bangladesh | 0.1 /100 | #266 | Tragic 5.3% |
| Immigrants | Western Africa | 0.0 /100 | #267 | Tragic 5.3% |
| Hawaiians | 0.0 /100 | #268 | Tragic 5.3% |
| Cajuns | 0.0 /100 | #269 | Tragic 5.3% |
| Blackfeet | 0.0 /100 | #270 | Tragic 5.3% |
| Ute | 0.0 /100 | #271 | Tragic 5.3% |
| Senegalese | 0.0 /100 | #272 | Tragic 5.3% |
| Vietnamese | 0.0 /100 | #273 | Tragic 5.4% |
| Creek | 0.0 /100 | #274 | Tragic 5.4% |
| Immigrants | Mexico | 0.0 /100 | #275 | Tragic 5.4% |
| Native Hawaiians | 0.0 /100 | #276 | Tragic 5.4% |
| Immigrants | Caribbean | 0.0 /100 | #277 | Tragic 5.4% |
| Lumbee | 0.0 /100 | #278 | Tragic 5.4% |