Kenyan vs Shoshone Unemployment
COMPARE
Kenyan
Shoshone
Unemployment
Unemployment Comparison
Kenyans
Shoshone
5.1%
UNEMPLOYMENT
88.2/ 100
METRIC RATING
126th/ 347
METRIC RANK
6.8%
UNEMPLOYMENT
0.0/ 100
METRIC RATING
317th/ 347
METRIC RANK
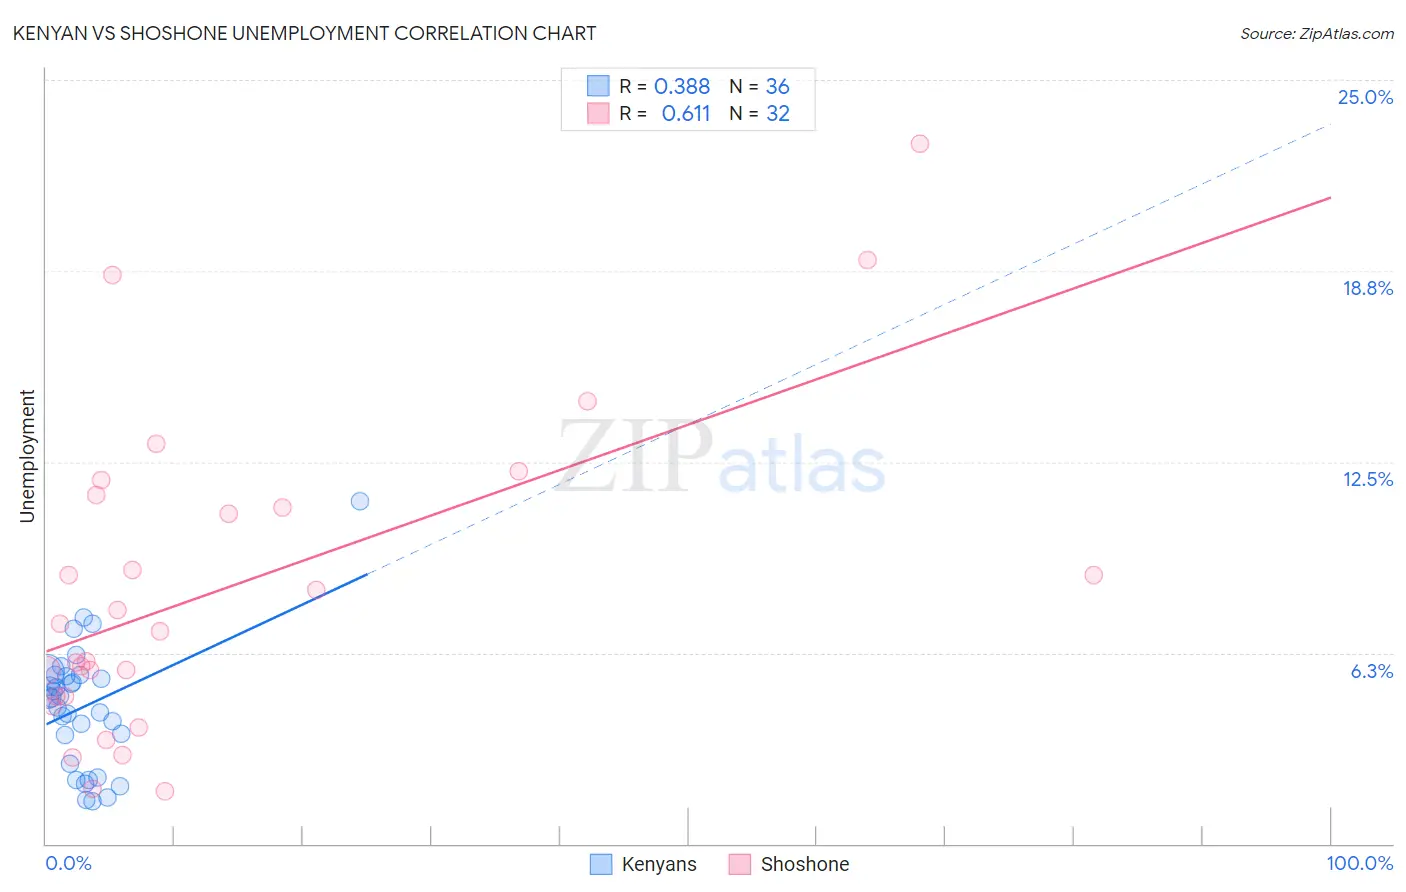
Kenyan vs Shoshone Unemployment Correlation Chart
The statistical analysis conducted on geographies consisting of 168,184,785 people shows a mild positive correlation between the proportion of Kenyans and unemployment in the United States with a correlation coefficient (R) of 0.388 and weighted average of 5.1%. Similarly, the statistical analysis conducted on geographies consisting of 66,583,051 people shows a significant positive correlation between the proportion of Shoshone and unemployment in the United States with a correlation coefficient (R) of 0.611 and weighted average of 6.8%, a difference of 33.1%.
Unemployment Correlation Summary
| Measurement | Kenyan | Shoshone |
| Minimum | 1.4% | 1.7% |
| Maximum | 11.2% | 22.9% |
| Range | 9.8% | 21.2% |
| Mean | 4.5% | 8.4% |
| Median | 4.8% | 7.1% |
| Interquartile 25% (IQ1) | 3.1% | 4.8% |
| Interquartile 75% (IQ3) | 5.5% | 11.2% |
| Interquartile Range (IQR) | 2.4% | 6.4% |
| Standard Deviation (Sample) | 2.0% | 5.1% |
| Standard Deviation (Population) | 2.0% | 5.1% |
Similar Demographics by Unemployment
Demographics Similar to Kenyans by Unemployment
In terms of unemployment, the demographic groups most similar to Kenyans are Immigrants from Kenya (5.1%, a difference of 0.0%), Immigrants from Eastern Asia (5.1%, a difference of 0.020%), Immigrants from Eastern Africa (5.1%, a difference of 0.020%), Immigrants from Latvia (5.1%, a difference of 0.020%), and Ethiopian (5.1%, a difference of 0.070%).
| Demographics | Rating | Rank | Unemployment |
| Immigrants | France | 89.7 /100 | #119 | Excellent 5.1% |
| Macedonians | 89.7 /100 | #120 | Excellent 5.1% |
| Lebanese | 89.2 /100 | #121 | Excellent 5.1% |
| Immigrants | Switzerland | 89.1 /100 | #122 | Excellent 5.1% |
| Asians | 89.0 /100 | #123 | Excellent 5.1% |
| Ethiopians | 88.6 /100 | #124 | Excellent 5.1% |
| Immigrants | Eastern Asia | 88.3 /100 | #125 | Excellent 5.1% |
| Kenyans | 88.2 /100 | #126 | Excellent 5.1% |
| Immigrants | Kenya | 88.2 /100 | #127 | Excellent 5.1% |
| Immigrants | Eastern Africa | 88.1 /100 | #128 | Excellent 5.1% |
| Immigrants | Latvia | 88.0 /100 | #129 | Excellent 5.1% |
| Iranians | 86.9 /100 | #130 | Excellent 5.1% |
| Immigrants | Croatia | 86.8 /100 | #131 | Excellent 5.1% |
| Immigrants | Ethiopia | 86.7 /100 | #132 | Excellent 5.1% |
| Immigrants | Jordan | 86.6 /100 | #133 | Excellent 5.1% |
Demographics Similar to Shoshone by Unemployment
In terms of unemployment, the demographic groups most similar to Shoshone are Immigrants from Dominica (6.7%, a difference of 0.58%), Immigrants from Cabo Verde (6.8%, a difference of 0.60%), British West Indian (6.8%, a difference of 0.81%), Houma (6.7%, a difference of 1.4%), and Immigrants from St. Vincent and the Grenadines (6.9%, a difference of 1.6%).
| Demographics | Rating | Rank | Unemployment |
| Immigrants | Belize | 0.0 /100 | #310 | Tragic 6.5% |
| Cape Verdeans | 0.0 /100 | #311 | Tragic 6.5% |
| Colville | 0.0 /100 | #312 | Tragic 6.6% |
| Immigrants | Barbados | 0.0 /100 | #313 | Tragic 6.6% |
| Blacks/African Americans | 0.0 /100 | #314 | Tragic 6.6% |
| Houma | 0.0 /100 | #315 | Tragic 6.7% |
| Immigrants | Dominica | 0.0 /100 | #316 | Tragic 6.7% |
| Shoshone | 0.0 /100 | #317 | Tragic 6.8% |
| Immigrants | Cabo Verde | 0.0 /100 | #318 | Tragic 6.8% |
| British West Indians | 0.0 /100 | #319 | Tragic 6.8% |
| Immigrants | St. Vincent and the Grenadines | 0.0 /100 | #320 | Tragic 6.9% |
| Immigrants | Guyana | 0.0 /100 | #321 | Tragic 6.9% |
| Guyanese | 0.0 /100 | #322 | Tragic 6.9% |
| Immigrants | Grenada | 0.0 /100 | #323 | Tragic 6.9% |
| Immigrants | Armenia | 0.0 /100 | #324 | Tragic 7.0% |