Jordanian vs Ugandan Unemployment Among Seniors over 65 years
COMPARE
Jordanian
Ugandan
Unemployment Among Seniors over 65 years
Unemployment Among Seniors over 65 years Comparison
Jordanians
Ugandans
4.9%
UNEMPLOYMENT AMONG SENIORS OVER 65 YEARS
99.9/ 100
METRIC RATING
44th/ 347
METRIC RANK
4.8%
UNEMPLOYMENT AMONG SENIORS OVER 65 YEARS
100.0/ 100
METRIC RATING
28th/ 347
METRIC RANK
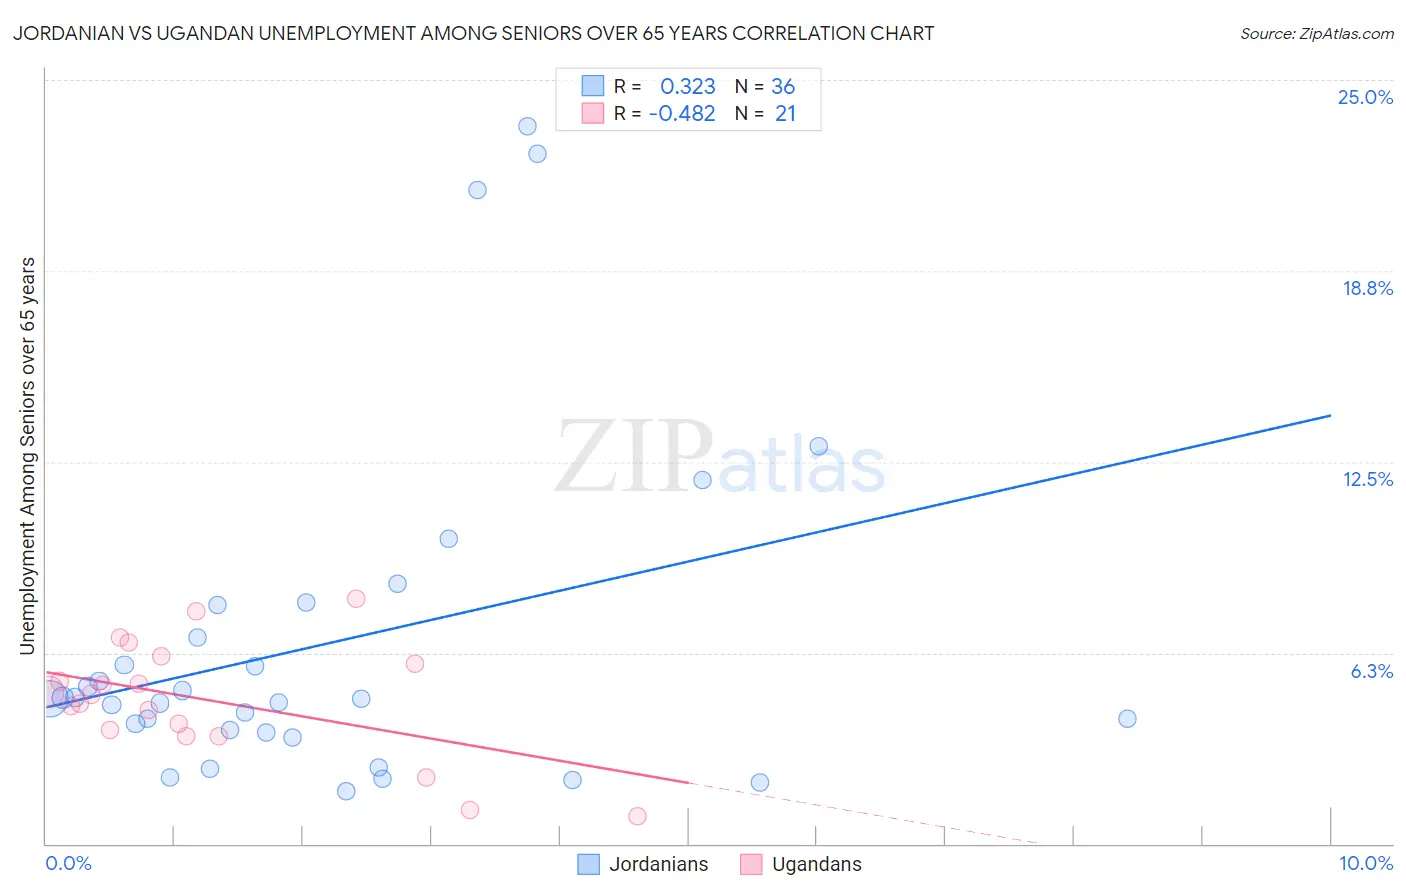
Jordanian vs Ugandan Unemployment Among Seniors over 65 years Correlation Chart
The statistical analysis conducted on geographies consisting of 160,431,135 people shows a mild positive correlation between the proportion of Jordanians and unemployment rate amomg seniors over the age of 65 in the United States with a correlation coefficient (R) of 0.323 and weighted average of 4.9%. Similarly, the statistical analysis conducted on geographies consisting of 91,863,177 people shows a moderate negative correlation between the proportion of Ugandans and unemployment rate amomg seniors over the age of 65 in the United States with a correlation coefficient (R) of -0.482 and weighted average of 4.8%, a difference of 1.7%.
Unemployment Among Seniors over 65 years Correlation Summary
| Measurement | Jordanian | Ugandan |
| Minimum | 1.7% | 0.90% |
| Maximum | 23.5% | 8.0% |
| Range | 21.8% | 7.1% |
| Mean | 6.5% | 4.7% |
| Median | 4.7% | 4.9% |
| Interquartile 25% (IQ1) | 3.7% | 3.6% |
| Interquartile 75% (IQ3) | 7.3% | 6.0% |
| Interquartile Range (IQR) | 3.6% | 2.4% |
| Standard Deviation (Sample) | 5.5% | 1.9% |
| Standard Deviation (Population) | 5.5% | 1.8% |
Demographics Similar to Jordanians and Ugandans by Unemployment Among Seniors over 65 years
In terms of unemployment among seniors over 65 years, the demographic groups most similar to Jordanians are Ethiopian (4.9%, a difference of 0.040%), Swiss (4.8%, a difference of 0.10%), Luxembourger (4.8%, a difference of 0.10%), Kiowa (4.8%, a difference of 0.11%), and Immigrants from Sweden (4.8%, a difference of 0.15%). Similarly, the demographic groups most similar to Ugandans are Houma (4.8%, a difference of 0.080%), Immigrants from North Macedonia (4.8%, a difference of 0.090%), Immigrants from Lebanon (4.8%, a difference of 0.15%), Belgian (4.8%, a difference of 0.49%), and Immigrants from Uganda (4.8%, a difference of 0.69%).
| Demographics | Rating | Rank | Unemployment Among Seniors over 65 years |
| Immigrants | Lebanon | 100.0 /100 | #26 | Exceptional 4.8% |
| Houma | 100.0 /100 | #27 | Exceptional 4.8% |
| Ugandans | 100.0 /100 | #28 | Exceptional 4.8% |
| Immigrants | North Macedonia | 100.0 /100 | #29 | Exceptional 4.8% |
| Belgians | 100.0 /100 | #30 | Exceptional 4.8% |
| Immigrants | Uganda | 100.0 /100 | #31 | Exceptional 4.8% |
| Slovenes | 100.0 /100 | #32 | Exceptional 4.8% |
| Palestinians | 100.0 /100 | #33 | Exceptional 4.8% |
| Bhutanese | 100.0 /100 | #34 | Exceptional 4.8% |
| Immigrants | Kuwait | 100.0 /100 | #35 | Exceptional 4.8% |
| Cambodians | 100.0 /100 | #36 | Exceptional 4.8% |
| Bulgarians | 99.9 /100 | #37 | Exceptional 4.8% |
| Immigrants | India | 99.9 /100 | #38 | Exceptional 4.8% |
| Macedonians | 99.9 /100 | #39 | Exceptional 4.8% |
| Immigrants | Sweden | 99.9 /100 | #40 | Exceptional 4.8% |
| Kiowa | 99.9 /100 | #41 | Exceptional 4.8% |
| Swiss | 99.9 /100 | #42 | Exceptional 4.8% |
| Luxembourgers | 99.9 /100 | #43 | Exceptional 4.8% |
| Jordanians | 99.9 /100 | #44 | Exceptional 4.9% |
| Ethiopians | 99.9 /100 | #45 | Exceptional 4.9% |
| Immigrants | Jordan | 99.9 /100 | #46 | Exceptional 4.9% |