Jordanian vs Immigrants from Cambodia Unemployment Among Seniors over 65 years
COMPARE
Jordanian
Immigrants from Cambodia
Unemployment Among Seniors over 65 years
Unemployment Among Seniors over 65 years Comparison
Jordanians
Immigrants from Cambodia
4.9%
UNEMPLOYMENT AMONG SENIORS OVER 65 YEARS
99.9/ 100
METRIC RATING
44th/ 347
METRIC RANK
4.9%
UNEMPLOYMENT AMONG SENIORS OVER 65 YEARS
99.6/ 100
METRIC RATING
64th/ 347
METRIC RANK
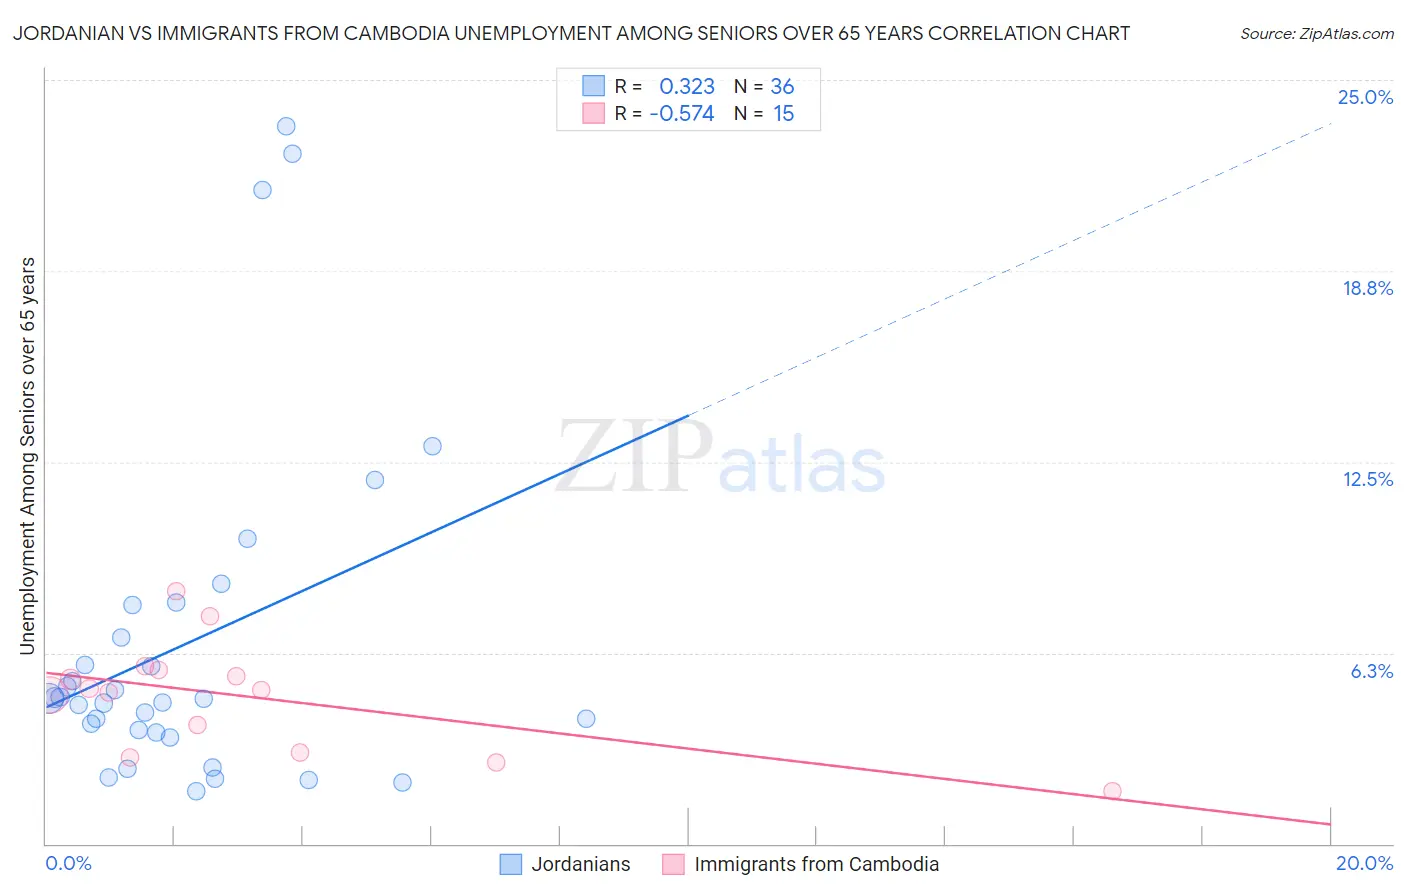
Jordanian vs Immigrants from Cambodia Unemployment Among Seniors over 65 years Correlation Chart
The statistical analysis conducted on geographies consisting of 160,431,135 people shows a mild positive correlation between the proportion of Jordanians and unemployment rate amomg seniors over the age of 65 in the United States with a correlation coefficient (R) of 0.323 and weighted average of 4.9%. Similarly, the statistical analysis conducted on geographies consisting of 194,845,295 people shows a substantial negative correlation between the proportion of Immigrants from Cambodia and unemployment rate amomg seniors over the age of 65 in the United States with a correlation coefficient (R) of -0.574 and weighted average of 4.9%, a difference of 1.3%.
Unemployment Among Seniors over 65 years Correlation Summary
| Measurement | Jordanian | Immigrants from Cambodia |
| Minimum | 1.7% | 1.7% |
| Maximum | 23.5% | 8.3% |
| Range | 21.8% | 6.6% |
| Mean | 6.5% | 4.8% |
| Median | 4.7% | 5.0% |
| Interquartile 25% (IQ1) | 3.7% | 3.0% |
| Interquartile 75% (IQ3) | 7.3% | 5.7% |
| Interquartile Range (IQR) | 3.6% | 2.7% |
| Standard Deviation (Sample) | 5.5% | 1.8% |
| Standard Deviation (Population) | 5.5% | 1.7% |
Demographics Similar to Jordanians and Immigrants from Cambodia by Unemployment Among Seniors over 65 years
In terms of unemployment among seniors over 65 years, the demographic groups most similar to Jordanians are Ethiopian (4.9%, a difference of 0.040%), Immigrants from Jordan (4.9%, a difference of 0.17%), German (4.9%, a difference of 0.20%), Choctaw (4.9%, a difference of 0.21%), and Immigrants from Kenya (4.9%, a difference of 0.40%). Similarly, the demographic groups most similar to Immigrants from Cambodia are Croatian (4.9%, a difference of 0.0%), Latvian (4.9%, a difference of 0.020%), Northern European (4.9%, a difference of 0.20%), Immigrants from Middle Africa (4.9%, a difference of 0.30%), and Immigrants from Eastern Africa (4.9%, a difference of 0.31%).
| Demographics | Rating | Rank | Unemployment Among Seniors over 65 years |
| Jordanians | 99.9 /100 | #44 | Exceptional 4.9% |
| Ethiopians | 99.9 /100 | #45 | Exceptional 4.9% |
| Immigrants | Jordan | 99.9 /100 | #46 | Exceptional 4.9% |
| Germans | 99.9 /100 | #47 | Exceptional 4.9% |
| Choctaw | 99.9 /100 | #48 | Exceptional 4.9% |
| Immigrants | Kenya | 99.9 /100 | #49 | Exceptional 4.9% |
| Immigrants | Austria | 99.9 /100 | #50 | Exceptional 4.9% |
| Scotch-Irish | 99.9 /100 | #51 | Exceptional 4.9% |
| Swedes | 99.9 /100 | #52 | Exceptional 4.9% |
| Immigrants | Sudan | 99.8 /100 | #53 | Exceptional 4.9% |
| Immigrants | Iraq | 99.8 /100 | #54 | Exceptional 4.9% |
| Europeans | 99.8 /100 | #55 | Exceptional 4.9% |
| Carpatho Rusyns | 99.8 /100 | #56 | Exceptional 4.9% |
| Danes | 99.8 /100 | #57 | Exceptional 4.9% |
| Scandinavians | 99.8 /100 | #58 | Exceptional 4.9% |
| Immigrants | Eastern Africa | 99.7 /100 | #59 | Exceptional 4.9% |
| Immigrants | Middle Africa | 99.7 /100 | #60 | Exceptional 4.9% |
| Northern Europeans | 99.7 /100 | #61 | Exceptional 4.9% |
| Latvians | 99.6 /100 | #62 | Exceptional 4.9% |
| Croatians | 99.6 /100 | #63 | Exceptional 4.9% |
| Immigrants | Cambodia | 99.6 /100 | #64 | Exceptional 4.9% |