Jordanian vs Northern European Unemployment Among Ages 35 to 44 years
COMPARE
Jordanian
Northern European
Unemployment Among Ages 35 to 44 years
Unemployment Among Ages 35 to 44 years Comparison
Jordanians
Northern Europeans
4.3%
UNEMPLOYMENT AMONG AGES 35 TO 44 YEARS
99.0/ 100
METRIC RATING
34th/ 347
METRIC RANK
4.4%
UNEMPLOYMENT AMONG AGES 35 TO 44 YEARS
96.5/ 100
METRIC RATING
72nd/ 347
METRIC RANK
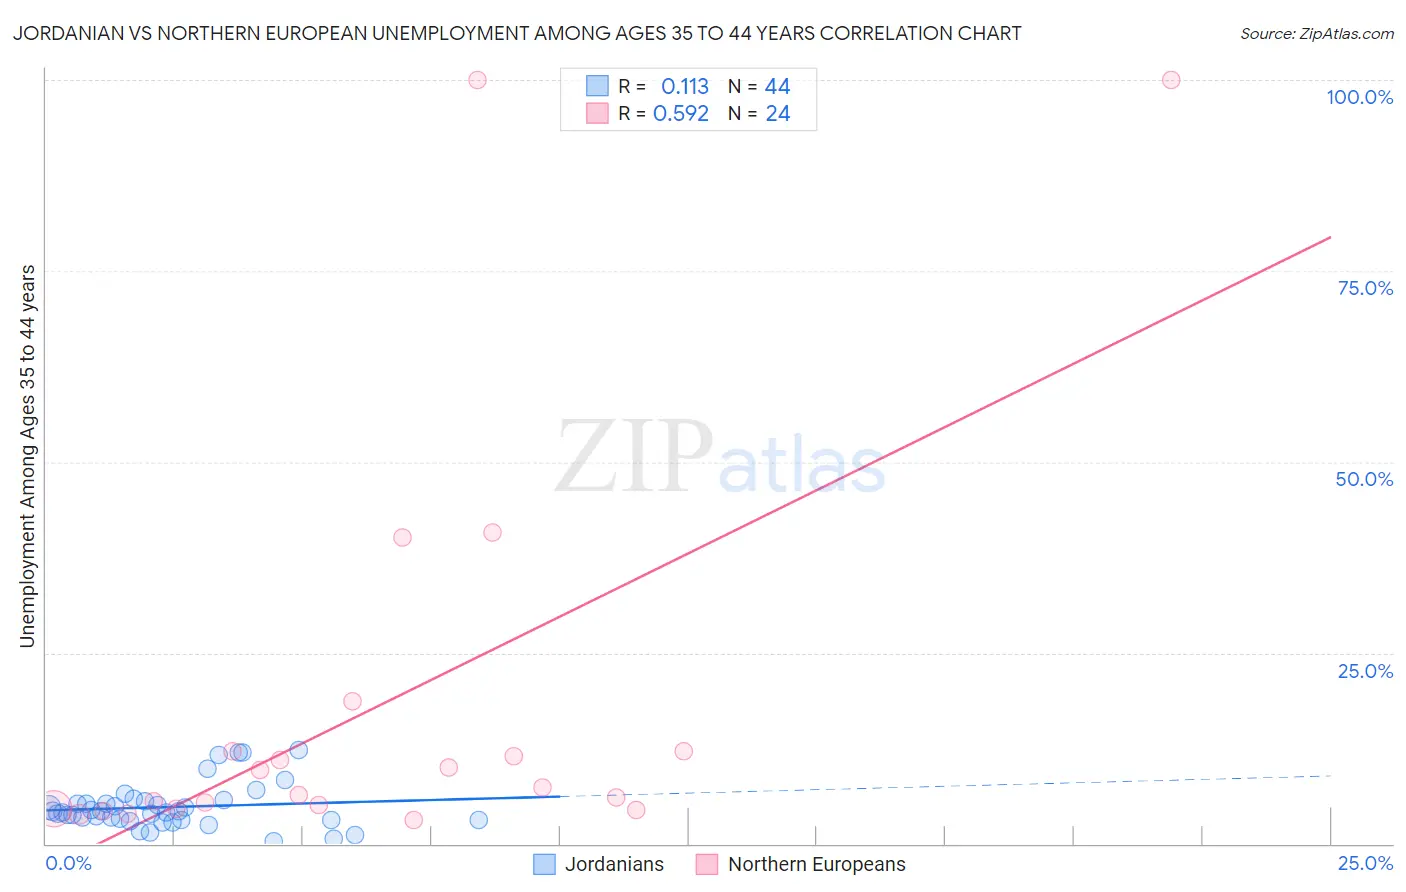
Jordanian vs Northern European Unemployment Among Ages 35 to 44 years Correlation Chart
The statistical analysis conducted on geographies consisting of 165,487,232 people shows a poor positive correlation between the proportion of Jordanians and unemployment rate among population between the ages 35 and 44 in the United States with a correlation coefficient (R) of 0.113 and weighted average of 4.3%. Similarly, the statistical analysis conducted on geographies consisting of 393,354,088 people shows a substantial positive correlation between the proportion of Northern Europeans and unemployment rate among population between the ages 35 and 44 in the United States with a correlation coefficient (R) of 0.592 and weighted average of 4.4%, a difference of 2.5%.
Unemployment Among Ages 35 to 44 years Correlation Summary
| Measurement | Jordanian | Northern European |
| Minimum | 0.40% | 3.1% |
| Maximum | 12.2% | 100.0% |
| Range | 11.8% | 96.9% |
| Mean | 4.8% | 17.9% |
| Median | 4.2% | 6.9% |
| Interquartile 25% (IQ1) | 3.1% | 4.6% |
| Interquartile 75% (IQ3) | 5.4% | 12.1% |
| Interquartile Range (IQR) | 2.3% | 7.5% |
| Standard Deviation (Sample) | 2.9% | 27.2% |
| Standard Deviation (Population) | 2.9% | 26.6% |
Similar Demographics by Unemployment Among Ages 35 to 44 years
Demographics Similar to Jordanians by Unemployment Among Ages 35 to 44 years
In terms of unemployment among ages 35 to 44 years, the demographic groups most similar to Jordanians are Luxembourger (4.3%, a difference of 0.030%), Mongolian (4.3%, a difference of 0.13%), Immigrants from Sri Lanka (4.3%, a difference of 0.15%), Immigrants from Zimbabwe (4.3%, a difference of 0.18%), and Burmese (4.3%, a difference of 0.25%).
| Demographics | Rating | Rank | Unemployment Among Ages 35 to 44 years |
| Assyrians/Chaldeans/Syriacs | 99.3 /100 | #27 | Exceptional 4.3% |
| Immigrants | Japan | 99.3 /100 | #28 | Exceptional 4.3% |
| Europeans | 99.2 /100 | #29 | Exceptional 4.3% |
| Immigrants | Pakistan | 99.2 /100 | #30 | Exceptional 4.3% |
| Carpatho Rusyns | 99.2 /100 | #31 | Exceptional 4.3% |
| Chinese | 99.1 /100 | #32 | Exceptional 4.3% |
| Immigrants | Sri Lanka | 99.1 /100 | #33 | Exceptional 4.3% |
| Jordanians | 99.0 /100 | #34 | Exceptional 4.3% |
| Luxembourgers | 99.0 /100 | #35 | Exceptional 4.3% |
| Mongolians | 98.9 /100 | #36 | Exceptional 4.3% |
| Immigrants | Zimbabwe | 98.9 /100 | #37 | Exceptional 4.3% |
| Burmese | 98.9 /100 | #38 | Exceptional 4.3% |
| Palestinians | 98.8 /100 | #39 | Exceptional 4.3% |
| Zimbabweans | 98.8 /100 | #40 | Exceptional 4.3% |
| Belgians | 98.7 /100 | #41 | Exceptional 4.3% |
Demographics Similar to Northern Europeans by Unemployment Among Ages 35 to 44 years
In terms of unemployment among ages 35 to 44 years, the demographic groups most similar to Northern Europeans are Lithuanian (4.4%, a difference of 0.030%), Polish (4.4%, a difference of 0.070%), Immigrants from Romania (4.4%, a difference of 0.090%), Slovene (4.4%, a difference of 0.12%), and Immigrants from China (4.4%, a difference of 0.12%).
| Demographics | Rating | Rank | Unemployment Among Ages 35 to 44 years |
| Cambodians | 97.0 /100 | #65 | Exceptional 4.4% |
| Icelanders | 96.8 /100 | #66 | Exceptional 4.4% |
| Argentineans | 96.8 /100 | #67 | Exceptional 4.4% |
| Immigrants | Ireland | 96.8 /100 | #68 | Exceptional 4.4% |
| Slovenes | 96.7 /100 | #69 | Exceptional 4.4% |
| Immigrants | China | 96.7 /100 | #70 | Exceptional 4.4% |
| Immigrants | Lithuania | 96.7 /100 | #71 | Exceptional 4.4% |
| Northern Europeans | 96.5 /100 | #72 | Exceptional 4.4% |
| Lithuanians | 96.5 /100 | #73 | Exceptional 4.4% |
| Poles | 96.4 /100 | #74 | Exceptional 4.4% |
| Immigrants | Romania | 96.3 /100 | #75 | Exceptional 4.4% |
| Immigrants | Jordan | 96.3 /100 | #76 | Exceptional 4.4% |
| Dutch | 96.1 /100 | #77 | Exceptional 4.4% |
| Indians (Asian) | 96.0 /100 | #78 | Exceptional 4.4% |
| Immigrants | Sweden | 95.9 /100 | #79 | Exceptional 4.4% |