Jordanian vs Dominican Unemployment Among Ages 35 to 44 years
COMPARE
Jordanian
Dominican
Unemployment Among Ages 35 to 44 years
Unemployment Among Ages 35 to 44 years Comparison
Jordanians
Dominicans
4.3%
UNEMPLOYMENT AMONG AGES 35 TO 44 YEARS
99.0/ 100
METRIC RATING
34th/ 347
METRIC RANK
6.4%
UNEMPLOYMENT AMONG AGES 35 TO 44 YEARS
0.0/ 100
METRIC RATING
323rd/ 347
METRIC RANK
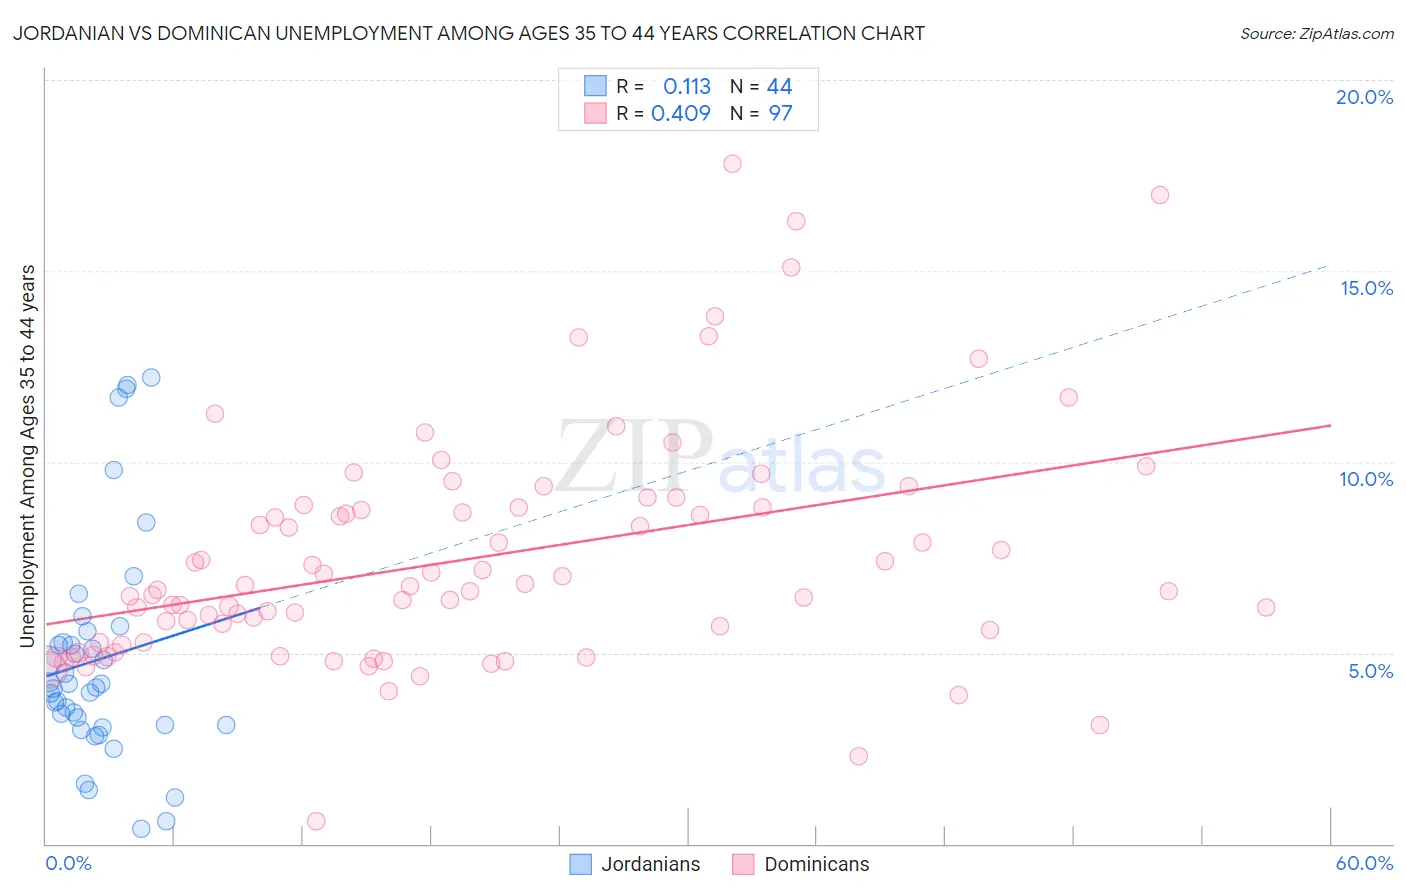
Jordanian vs Dominican Unemployment Among Ages 35 to 44 years Correlation Chart
The statistical analysis conducted on geographies consisting of 165,487,232 people shows a poor positive correlation between the proportion of Jordanians and unemployment rate among population between the ages 35 and 44 in the United States with a correlation coefficient (R) of 0.113 and weighted average of 4.3%. Similarly, the statistical analysis conducted on geographies consisting of 348,071,725 people shows a moderate positive correlation between the proportion of Dominicans and unemployment rate among population between the ages 35 and 44 in the United States with a correlation coefficient (R) of 0.409 and weighted average of 6.4%, a difference of 49.2%.
Unemployment Among Ages 35 to 44 years Correlation Summary
| Measurement | Jordanian | Dominican |
| Minimum | 0.40% | 0.60% |
| Maximum | 12.2% | 17.8% |
| Range | 11.8% | 17.2% |
| Mean | 4.8% | 7.5% |
| Median | 4.2% | 6.7% |
| Interquartile 25% (IQ1) | 3.1% | 5.2% |
| Interquartile 75% (IQ3) | 5.4% | 8.8% |
| Interquartile Range (IQR) | 2.3% | 3.6% |
| Standard Deviation (Sample) | 2.9% | 3.0% |
| Standard Deviation (Population) | 2.9% | 3.0% |
Similar Demographics by Unemployment Among Ages 35 to 44 years
Demographics Similar to Jordanians by Unemployment Among Ages 35 to 44 years
In terms of unemployment among ages 35 to 44 years, the demographic groups most similar to Jordanians are Luxembourger (4.3%, a difference of 0.030%), Mongolian (4.3%, a difference of 0.13%), Immigrants from Sri Lanka (4.3%, a difference of 0.15%), Immigrants from Zimbabwe (4.3%, a difference of 0.18%), and Burmese (4.3%, a difference of 0.25%).
| Demographics | Rating | Rank | Unemployment Among Ages 35 to 44 years |
| Assyrians/Chaldeans/Syriacs | 99.3 /100 | #27 | Exceptional 4.3% |
| Immigrants | Japan | 99.3 /100 | #28 | Exceptional 4.3% |
| Europeans | 99.2 /100 | #29 | Exceptional 4.3% |
| Immigrants | Pakistan | 99.2 /100 | #30 | Exceptional 4.3% |
| Carpatho Rusyns | 99.2 /100 | #31 | Exceptional 4.3% |
| Chinese | 99.1 /100 | #32 | Exceptional 4.3% |
| Immigrants | Sri Lanka | 99.1 /100 | #33 | Exceptional 4.3% |
| Jordanians | 99.0 /100 | #34 | Exceptional 4.3% |
| Luxembourgers | 99.0 /100 | #35 | Exceptional 4.3% |
| Mongolians | 98.9 /100 | #36 | Exceptional 4.3% |
| Immigrants | Zimbabwe | 98.9 /100 | #37 | Exceptional 4.3% |
| Burmese | 98.9 /100 | #38 | Exceptional 4.3% |
| Palestinians | 98.8 /100 | #39 | Exceptional 4.3% |
| Zimbabweans | 98.8 /100 | #40 | Exceptional 4.3% |
| Belgians | 98.7 /100 | #41 | Exceptional 4.3% |
Demographics Similar to Dominicans by Unemployment Among Ages 35 to 44 years
In terms of unemployment among ages 35 to 44 years, the demographic groups most similar to Dominicans are Immigrants from Dominican Republic (6.4%, a difference of 0.080%), Menominee (6.5%, a difference of 1.6%), Immigrants from Yemen (6.6%, a difference of 1.9%), Alaska Native (6.6%, a difference of 2.0%), and Cape Verdean (6.6%, a difference of 2.1%).
| Demographics | Rating | Rank | Unemployment Among Ages 35 to 44 years |
| Tsimshian | 0.0 /100 | #316 | Tragic 6.2% |
| Immigrants | St. Vincent and the Grenadines | 0.0 /100 | #317 | Tragic 6.2% |
| Colville | 0.0 /100 | #318 | Tragic 6.2% |
| Immigrants | Grenada | 0.0 /100 | #319 | Tragic 6.2% |
| Immigrants | Armenia | 0.0 /100 | #320 | Tragic 6.2% |
| Chippewa | 0.0 /100 | #321 | Tragic 6.2% |
| Immigrants | Dominican Republic | 0.0 /100 | #322 | Tragic 6.4% |
| Dominicans | 0.0 /100 | #323 | Tragic 6.4% |
| Menominee | 0.0 /100 | #324 | Tragic 6.5% |
| Immigrants | Yemen | 0.0 /100 | #325 | Tragic 6.6% |
| Alaska Natives | 0.0 /100 | #326 | Tragic 6.6% |
| Cape Verdeans | 0.0 /100 | #327 | Tragic 6.6% |
| Shoshone | 0.0 /100 | #328 | Tragic 6.6% |
| Paiute | 0.0 /100 | #329 | Tragic 6.9% |
| Immigrants | Cabo Verde | 0.0 /100 | #330 | Tragic 6.9% |