Jordanian vs Egyptian Unemployment Among Women with Children Under 18 years
COMPARE
Jordanian
Egyptian
Unemployment Among Women with Children Under 18 years
Unemployment Among Women with Children Under 18 years Comparison
Jordanians
Egyptians
5.3%
UNEMPLOYMENT AMONG WOMEN WITH CHILDREN UNDER 18 YEARS
78.8/ 100
METRIC RATING
137th/ 347
METRIC RANK
5.3%
UNEMPLOYMENT AMONG WOMEN WITH CHILDREN UNDER 18 YEARS
86.4/ 100
METRIC RATING
120th/ 347
METRIC RANK
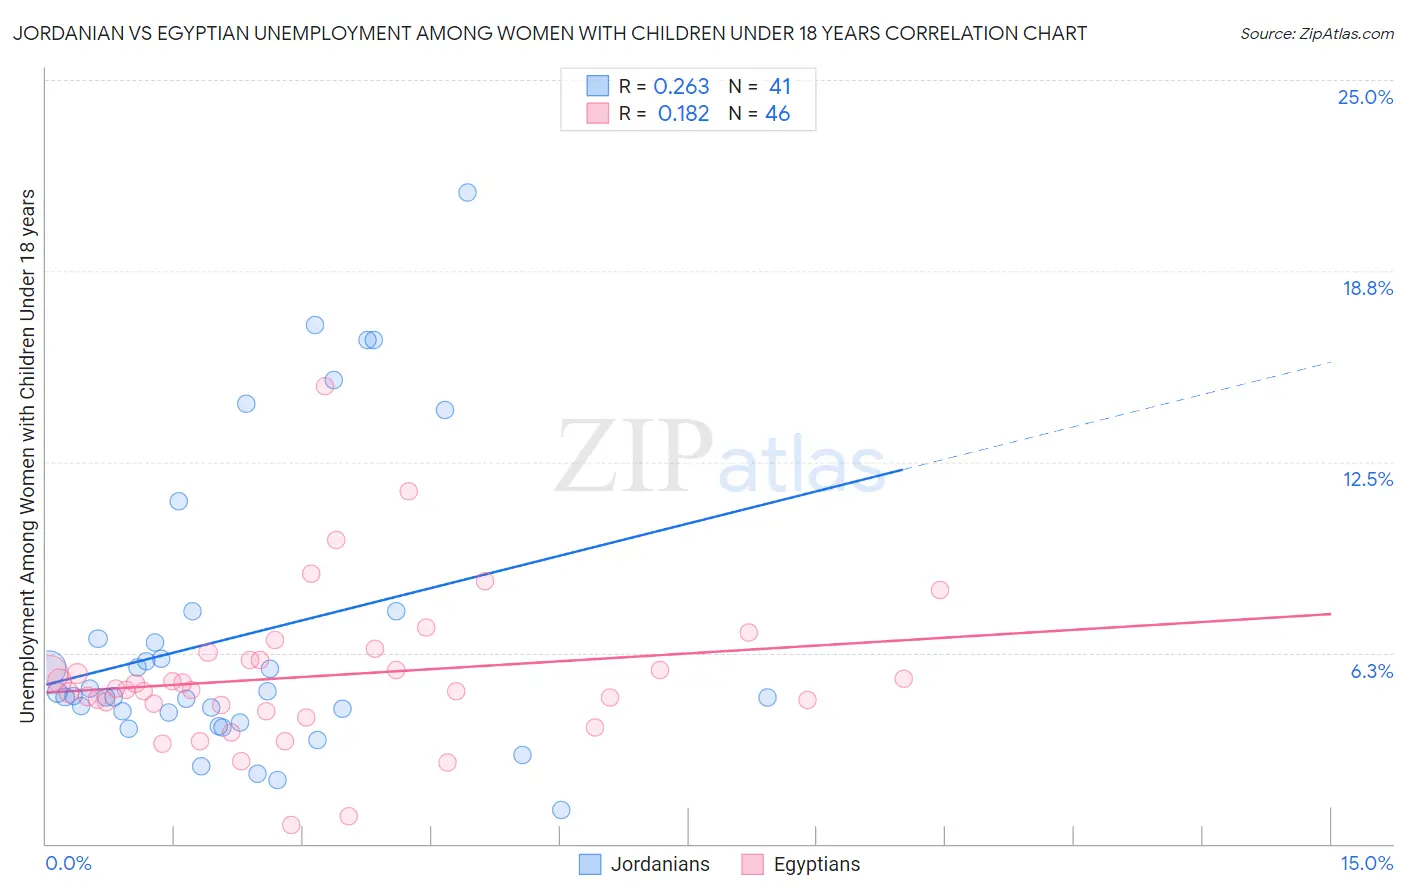
Jordanian vs Egyptian Unemployment Among Women with Children Under 18 years Correlation Chart
The statistical analysis conducted on geographies consisting of 164,217,063 people shows a weak positive correlation between the proportion of Jordanians and unemployment rate among women with children under the age of 18 in the United States with a correlation coefficient (R) of 0.263 and weighted average of 5.3%. Similarly, the statistical analysis conducted on geographies consisting of 270,511,535 people shows a poor positive correlation between the proportion of Egyptians and unemployment rate among women with children under the age of 18 in the United States with a correlation coefficient (R) of 0.182 and weighted average of 5.3%, a difference of 0.98%.
Unemployment Among Women with Children Under 18 years Correlation Summary
| Measurement | Jordanian | Egyptian |
| Minimum | 1.1% | 0.60% |
| Maximum | 21.3% | 15.0% |
| Range | 20.2% | 14.4% |
| Mean | 6.8% | 5.5% |
| Median | 4.8% | 5.1% |
| Interquartile 25% (IQ1) | 4.1% | 4.5% |
| Interquartile 75% (IQ3) | 7.2% | 6.0% |
| Interquartile Range (IQR) | 3.0% | 1.5% |
| Standard Deviation (Sample) | 4.8% | 2.5% |
| Standard Deviation (Population) | 4.8% | 2.4% |
Demographics Similar to Jordanians and Egyptians by Unemployment Among Women with Children Under 18 years
In terms of unemployment among women with children under 18 years, the demographic groups most similar to Jordanians are Argentinean (5.3%, a difference of 0.010%), Immigrants from Jordan (5.3%, a difference of 0.070%), New Zealander (5.3%, a difference of 0.12%), Slovak (5.3%, a difference of 0.19%), and Ethiopian (5.3%, a difference of 0.21%). Similarly, the demographic groups most similar to Egyptians are Basque (5.3%, a difference of 0.020%), Immigrants from Europe (5.3%, a difference of 0.050%), Immigrants from Romania (5.3%, a difference of 0.090%), Scotch-Irish (5.3%, a difference of 0.11%), and Sudanese (5.3%, a difference of 0.30%).
| Demographics | Rating | Rank | Unemployment Among Women with Children Under 18 years |
| Immigrants | Europe | 86.7 /100 | #118 | Excellent 5.3% |
| Basques | 86.5 /100 | #119 | Excellent 5.3% |
| Egyptians | 86.4 /100 | #120 | Excellent 5.3% |
| Immigrants | Romania | 85.8 /100 | #121 | Excellent 5.3% |
| Scotch-Irish | 85.7 /100 | #122 | Excellent 5.3% |
| Sudanese | 84.3 /100 | #123 | Excellent 5.3% |
| Native Hawaiians | 84.0 /100 | #124 | Excellent 5.3% |
| Immigrants | North Macedonia | 83.2 /100 | #125 | Excellent 5.3% |
| Immigrants | Oceania | 83.1 /100 | #126 | Excellent 5.3% |
| Whites/Caucasians | 82.9 /100 | #127 | Excellent 5.3% |
| Immigrants | South Africa | 82.8 /100 | #128 | Excellent 5.3% |
| Immigrants | Italy | 82.3 /100 | #129 | Excellent 5.3% |
| Immigrants | Austria | 82.1 /100 | #130 | Excellent 5.3% |
| Immigrants | Israel | 81.9 /100 | #131 | Excellent 5.3% |
| Immigrants | Ethiopia | 81.4 /100 | #132 | Excellent 5.3% |
| Ethiopians | 80.7 /100 | #133 | Excellent 5.3% |
| Slovaks | 80.5 /100 | #134 | Excellent 5.3% |
| New Zealanders | 79.9 /100 | #135 | Good 5.3% |
| Immigrants | Jordan | 79.5 /100 | #136 | Good 5.3% |
| Jordanians | 78.8 /100 | #137 | Good 5.3% |
| Argentineans | 78.8 /100 | #138 | Good 5.3% |