Immigrants from Liberia vs Egyptian Unemployment Among Women with Children Under 18 years
COMPARE
Immigrants from Liberia
Egyptian
Unemployment Among Women with Children Under 18 years
Unemployment Among Women with Children Under 18 years Comparison
Immigrants from Liberia
Egyptians
6.1%
UNEMPLOYMENT AMONG WOMEN WITH CHILDREN UNDER 18 YEARS
0.1/ 100
METRIC RATING
261st/ 347
METRIC RANK
5.3%
UNEMPLOYMENT AMONG WOMEN WITH CHILDREN UNDER 18 YEARS
86.4/ 100
METRIC RATING
120th/ 347
METRIC RANK
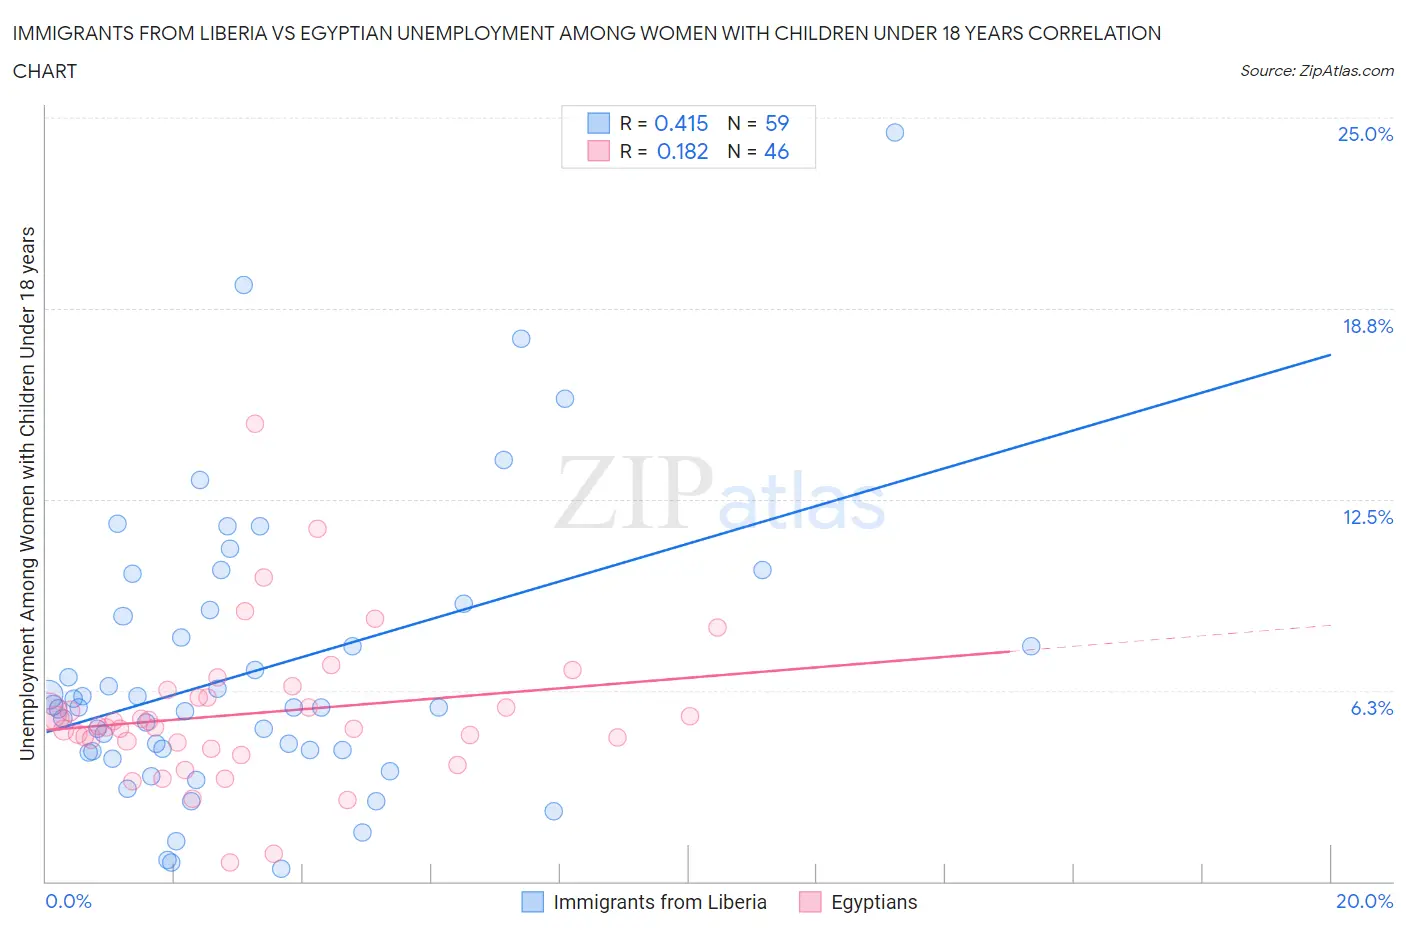
Immigrants from Liberia vs Egyptian Unemployment Among Women with Children Under 18 years Correlation Chart
The statistical analysis conducted on geographies consisting of 133,879,342 people shows a moderate positive correlation between the proportion of Immigrants from Liberia and unemployment rate among women with children under the age of 18 in the United States with a correlation coefficient (R) of 0.415 and weighted average of 6.1%. Similarly, the statistical analysis conducted on geographies consisting of 270,511,535 people shows a poor positive correlation between the proportion of Egyptians and unemployment rate among women with children under the age of 18 in the United States with a correlation coefficient (R) of 0.182 and weighted average of 5.3%, a difference of 16.5%.
Unemployment Among Women with Children Under 18 years Correlation Summary
| Measurement | Immigrants from Liberia | Egyptian |
| Minimum | 0.40% | 0.60% |
| Maximum | 24.5% | 15.0% |
| Range | 24.1% | 14.4% |
| Mean | 6.9% | 5.5% |
| Median | 5.7% | 5.1% |
| Interquartile 25% (IQ1) | 4.2% | 4.5% |
| Interquartile 75% (IQ3) | 8.9% | 6.0% |
| Interquartile Range (IQR) | 4.6% | 1.5% |
| Standard Deviation (Sample) | 4.7% | 2.5% |
| Standard Deviation (Population) | 4.6% | 2.4% |
Similar Demographics by Unemployment Among Women with Children Under 18 years
Demographics Similar to Immigrants from Liberia by Unemployment Among Women with Children Under 18 years
In terms of unemployment among women with children under 18 years, the demographic groups most similar to Immigrants from Liberia are Immigrants from Trinidad and Tobago (6.1%, a difference of 0.0%), Spanish American Indian (6.1%, a difference of 0.020%), Comanche (6.1%, a difference of 0.090%), Nigerian (6.1%, a difference of 0.10%), and Ottawa (6.1%, a difference of 0.12%).
| Demographics | Rating | Rank | Unemployment Among Women with Children Under 18 years |
| Immigrants | Azores | 0.3 /100 | #254 | Tragic 6.0% |
| Liberians | 0.2 /100 | #255 | Tragic 6.0% |
| Nepalese | 0.2 /100 | #256 | Tragic 6.0% |
| Bermudans | 0.1 /100 | #257 | Tragic 6.1% |
| Immigrants | Nigeria | 0.1 /100 | #258 | Tragic 6.1% |
| Ottawa | 0.1 /100 | #259 | Tragic 6.1% |
| Nigerians | 0.1 /100 | #260 | Tragic 6.1% |
| Immigrants | Liberia | 0.1 /100 | #261 | Tragic 6.1% |
| Immigrants | Trinidad and Tobago | 0.1 /100 | #262 | Tragic 6.1% |
| Spanish American Indians | 0.1 /100 | #263 | Tragic 6.1% |
| Comanche | 0.1 /100 | #264 | Tragic 6.1% |
| Immigrants | Bahamas | 0.1 /100 | #265 | Tragic 6.1% |
| Sub-Saharan Africans | 0.1 /100 | #266 | Tragic 6.2% |
| French American Indians | 0.1 /100 | #267 | Tragic 6.2% |
| Trinidadians and Tobagonians | 0.1 /100 | #268 | Tragic 6.2% |
Demographics Similar to Egyptians by Unemployment Among Women with Children Under 18 years
In terms of unemployment among women with children under 18 years, the demographic groups most similar to Egyptians are Basque (5.3%, a difference of 0.020%), Immigrants from Europe (5.3%, a difference of 0.050%), Immigrants from Romania (5.3%, a difference of 0.090%), Scotch-Irish (5.3%, a difference of 0.11%), and Canadian (5.3%, a difference of 0.15%).
| Demographics | Rating | Rank | Unemployment Among Women with Children Under 18 years |
| French | 88.4 /100 | #113 | Excellent 5.2% |
| Kenyans | 88.2 /100 | #114 | Excellent 5.3% |
| Hungarians | 88.1 /100 | #115 | Excellent 5.3% |
| Macedonians | 87.7 /100 | #116 | Excellent 5.3% |
| Canadians | 87.4 /100 | #117 | Excellent 5.3% |
| Immigrants | Europe | 86.7 /100 | #118 | Excellent 5.3% |
| Basques | 86.5 /100 | #119 | Excellent 5.3% |
| Egyptians | 86.4 /100 | #120 | Excellent 5.3% |
| Immigrants | Romania | 85.8 /100 | #121 | Excellent 5.3% |
| Scotch-Irish | 85.7 /100 | #122 | Excellent 5.3% |
| Sudanese | 84.3 /100 | #123 | Excellent 5.3% |
| Native Hawaiians | 84.0 /100 | #124 | Excellent 5.3% |
| Immigrants | North Macedonia | 83.2 /100 | #125 | Excellent 5.3% |
| Immigrants | Oceania | 83.1 /100 | #126 | Excellent 5.3% |
| Whites/Caucasians | 82.9 /100 | #127 | Excellent 5.3% |