Jordanian vs Czechoslovakian Unemployment Among Ages 20 to 24 years
COMPARE
Jordanian
Czechoslovakian
Unemployment Among Ages 20 to 24 years
Unemployment Among Ages 20 to 24 years Comparison
Jordanians
Czechoslovakians
10.1%
UNEMPLOYMENT AMONG AGES 20 TO 24 YEARS
86.1/ 100
METRIC RATING
126th/ 347
METRIC RANK
9.9%
UNEMPLOYMENT AMONG AGES 20 TO 24 YEARS
98.4/ 100
METRIC RATING
76th/ 347
METRIC RANK
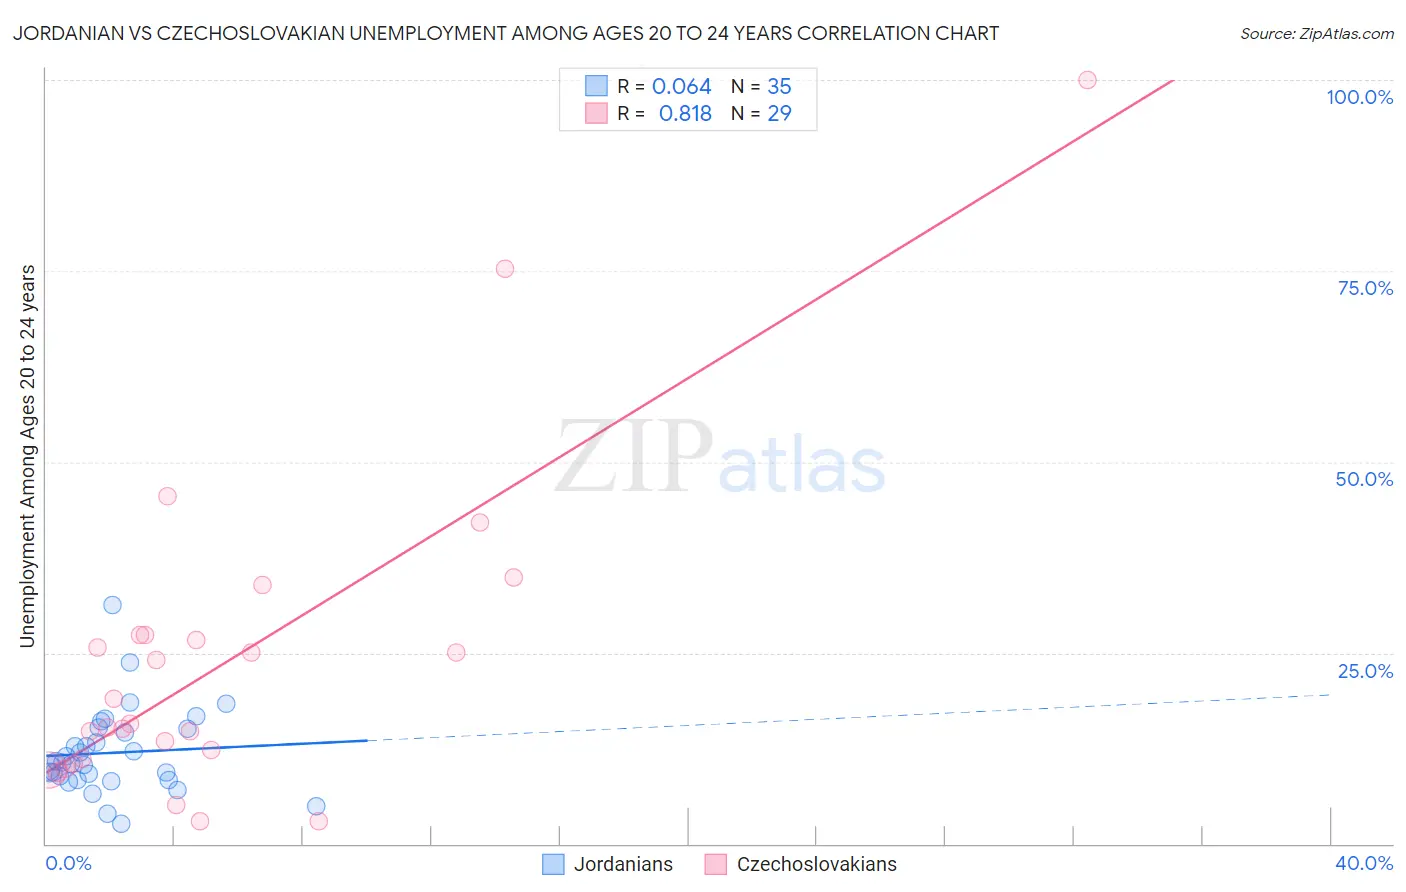
Jordanian vs Czechoslovakian Unemployment Among Ages 20 to 24 years Correlation Chart
The statistical analysis conducted on geographies consisting of 164,800,700 people shows a slight positive correlation between the proportion of Jordanians and unemployment rate among population between the ages 20 and 24 in the United States with a correlation coefficient (R) of 0.064 and weighted average of 10.1%. Similarly, the statistical analysis conducted on geographies consisting of 353,897,450 people shows a very strong positive correlation between the proportion of Czechoslovakians and unemployment rate among population between the ages 20 and 24 in the United States with a correlation coefficient (R) of 0.818 and weighted average of 9.9%, a difference of 2.2%.
Unemployment Among Ages 20 to 24 years Correlation Summary
| Measurement | Jordanian | Czechoslovakian |
| Minimum | 2.7% | 2.9% |
| Maximum | 31.3% | 100.0% |
| Range | 28.6% | 97.1% |
| Mean | 11.9% | 23.9% |
| Median | 10.7% | 15.7% |
| Interquartile 25% (IQ1) | 8.3% | 10.8% |
| Interquartile 75% (IQ3) | 15.1% | 27.3% |
| Interquartile Range (IQR) | 6.8% | 16.5% |
| Standard Deviation (Sample) | 5.5% | 21.0% |
| Standard Deviation (Population) | 5.5% | 20.6% |
Similar Demographics by Unemployment Among Ages 20 to 24 years
Demographics Similar to Jordanians by Unemployment Among Ages 20 to 24 years
In terms of unemployment among ages 20 to 24 years, the demographic groups most similar to Jordanians are Spanish (10.1%, a difference of 0.0%), Immigrants from Japan (10.1%, a difference of 0.030%), Immigrants from Norway (10.1%, a difference of 0.060%), Immigrants from Iraq (10.1%, a difference of 0.080%), and Immigrants from Brazil (10.1%, a difference of 0.090%).
| Demographics | Rating | Rank | Unemployment Among Ages 20 to 24 years |
| French | 88.2 /100 | #119 | Excellent 10.1% |
| Immigrants | Canada | 88.2 /100 | #120 | Excellent 10.1% |
| South Africans | 87.8 /100 | #121 | Excellent 10.1% |
| Whites/Caucasians | 87.4 /100 | #122 | Excellent 10.1% |
| Immigrants | Iraq | 87.1 /100 | #123 | Excellent 10.1% |
| Immigrants | Japan | 86.5 /100 | #124 | Excellent 10.1% |
| Spanish | 86.1 /100 | #125 | Excellent 10.1% |
| Jordanians | 86.1 /100 | #126 | Excellent 10.1% |
| Immigrants | Norway | 85.3 /100 | #127 | Excellent 10.1% |
| Immigrants | Brazil | 84.9 /100 | #128 | Excellent 10.1% |
| Immigrants | South Central Asia | 84.6 /100 | #129 | Excellent 10.1% |
| Immigrants | Lithuania | 84.2 /100 | #130 | Excellent 10.1% |
| Seminole | 84.2 /100 | #131 | Excellent 10.1% |
| Immigrants | South Eastern Asia | 84.0 /100 | #132 | Excellent 10.1% |
| Austrians | 83.9 /100 | #133 | Excellent 10.2% |
Demographics Similar to Czechoslovakians by Unemployment Among Ages 20 to 24 years
In terms of unemployment among ages 20 to 24 years, the demographic groups most similar to Czechoslovakians are Chickasaw (9.9%, a difference of 0.020%), Assyrian/Chaldean/Syriac (9.9%, a difference of 0.050%), Icelander (9.9%, a difference of 0.070%), Immigrants from Australia (9.9%, a difference of 0.090%), and Immigrants from Netherlands (9.9%, a difference of 0.12%).
| Demographics | Rating | Rank | Unemployment Among Ages 20 to 24 years |
| Bulgarians | 99.1 /100 | #69 | Exceptional 9.9% |
| Immigrants | Croatia | 99.0 /100 | #70 | Exceptional 9.9% |
| Celtics | 98.9 /100 | #71 | Exceptional 9.9% |
| Bolivians | 98.9 /100 | #72 | Exceptional 9.9% |
| Kenyans | 98.7 /100 | #73 | Exceptional 9.9% |
| Immigrants | Laos | 98.7 /100 | #74 | Exceptional 9.9% |
| Immigrants | Australia | 98.6 /100 | #75 | Exceptional 9.9% |
| Czechoslovakians | 98.4 /100 | #76 | Exceptional 9.9% |
| Chickasaw | 98.4 /100 | #77 | Exceptional 9.9% |
| Assyrians/Chaldeans/Syriacs | 98.3 /100 | #78 | Exceptional 9.9% |
| Icelanders | 98.3 /100 | #79 | Exceptional 9.9% |
| Immigrants | Netherlands | 98.2 /100 | #80 | Exceptional 9.9% |
| Yaqui | 98.0 /100 | #81 | Exceptional 9.9% |
| Sri Lankans | 98.0 /100 | #82 | Exceptional 9.9% |
| Immigrants | Bulgaria | 98.0 /100 | #83 | Exceptional 9.9% |