Japanese vs Immigrants from Czechoslovakia Unemployment Among Youth under 25 years
COMPARE
Japanese
Immigrants from Czechoslovakia
Unemployment Among Youth under 25 years
Unemployment Among Youth under 25 years Comparison
Japanese
Immigrants from Czechoslovakia
11.7%
UNEMPLOYMENT AMONG YOUTH UNDER 25 YEARS
30.8/ 100
METRIC RATING
189th/ 347
METRIC RANK
11.5%
UNEMPLOYMENT AMONG YOUTH UNDER 25 YEARS
67.1/ 100
METRIC RATING
153rd/ 347
METRIC RANK
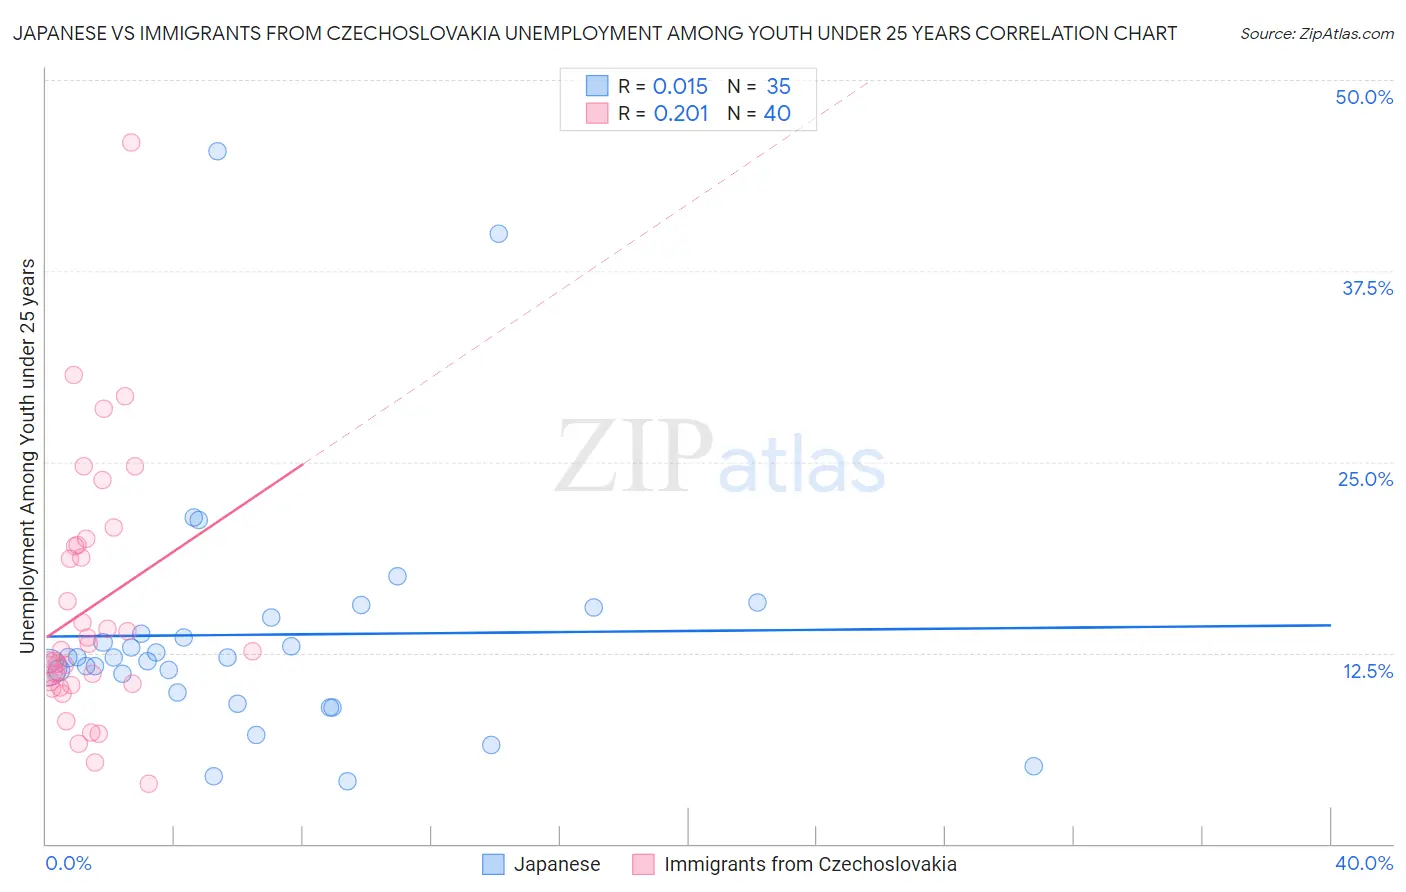
Japanese vs Immigrants from Czechoslovakia Unemployment Among Youth under 25 years Correlation Chart
The statistical analysis conducted on geographies consisting of 248,034,064 people shows no correlation between the proportion of Japanese and unemployment rate among youth under the age of 25 in the United States with a correlation coefficient (R) of 0.015 and weighted average of 11.7%. Similarly, the statistical analysis conducted on geographies consisting of 194,232,331 people shows a weak positive correlation between the proportion of Immigrants from Czechoslovakia and unemployment rate among youth under the age of 25 in the United States with a correlation coefficient (R) of 0.201 and weighted average of 11.5%, a difference of 1.6%.
Unemployment Among Youth under 25 years Correlation Summary
| Measurement | Japanese | Immigrants from Czechoslovakia |
| Minimum | 4.1% | 3.9% |
| Maximum | 45.3% | 45.9% |
| Range | 41.2% | 42.0% |
| Mean | 13.7% | 15.4% |
| Median | 12.2% | 12.7% |
| Interquartile 25% (IQ1) | 9.9% | 10.4% |
| Interquartile 75% (IQ3) | 14.8% | 19.5% |
| Interquartile Range (IQR) | 4.9% | 9.1% |
| Standard Deviation (Sample) | 8.2% | 8.3% |
| Standard Deviation (Population) | 8.1% | 8.2% |
Similar Demographics by Unemployment Among Youth under 25 years
Demographics Similar to Japanese by Unemployment Among Youth under 25 years
In terms of unemployment among youth under 25 years, the demographic groups most similar to Japanese are Portuguese (11.7%, a difference of 0.020%), Immigrants from Poland (11.7%, a difference of 0.030%), Immigrants from Egypt (11.7%, a difference of 0.050%), Cypriot (11.7%, a difference of 0.11%), and Immigrants from Russia (11.7%, a difference of 0.11%).
| Demographics | Rating | Rank | Unemployment Among Youth under 25 years |
| Immigrants | Italy | 36.2 /100 | #182 | Fair 11.7% |
| Americans | 34.5 /100 | #183 | Fair 11.7% |
| Immigrants | Eastern Europe | 34.1 /100 | #184 | Fair 11.7% |
| French American Indians | 34.0 /100 | #185 | Fair 11.7% |
| Maltese | 33.9 /100 | #186 | Fair 11.7% |
| Immigrants | Egypt | 31.9 /100 | #187 | Fair 11.7% |
| Immigrants | Poland | 31.4 /100 | #188 | Fair 11.7% |
| Japanese | 30.8 /100 | #189 | Fair 11.7% |
| Portuguese | 30.3 /100 | #190 | Fair 11.7% |
| Cypriots | 28.5 /100 | #191 | Fair 11.7% |
| Immigrants | Russia | 28.5 /100 | #192 | Fair 11.7% |
| Seminole | 27.9 /100 | #193 | Fair 11.7% |
| Immigrants | Sri Lanka | 27.8 /100 | #194 | Fair 11.7% |
| Paraguayans | 27.2 /100 | #195 | Fair 11.7% |
| Egyptians | 26.9 /100 | #196 | Fair 11.7% |
Demographics Similar to Immigrants from Czechoslovakia by Unemployment Among Youth under 25 years
In terms of unemployment among youth under 25 years, the demographic groups most similar to Immigrants from Czechoslovakia are Immigrants from Asia (11.5%, a difference of 0.020%), Immigrants from Romania (11.5%, a difference of 0.040%), Iraqi (11.5%, a difference of 0.060%), Immigrants from Germany (11.5%, a difference of 0.060%), and Indian (Asian) (11.5%, a difference of 0.090%).
| Demographics | Rating | Rank | Unemployment Among Youth under 25 years |
| Brazilians | 72.5 /100 | #146 | Good 11.5% |
| Laotians | 72.4 /100 | #147 | Good 11.5% |
| Immigrants | Northern Europe | 72.1 /100 | #148 | Good 11.5% |
| Immigrants | Cambodia | 71.8 /100 | #149 | Good 11.5% |
| Immigrants | Switzerland | 71.6 /100 | #150 | Good 11.5% |
| Uruguayans | 70.4 /100 | #151 | Good 11.5% |
| Iraqis | 68.3 /100 | #152 | Good 11.5% |
| Immigrants | Czechoslovakia | 67.1 /100 | #153 | Good 11.5% |
| Immigrants | Asia | 66.7 /100 | #154 | Good 11.5% |
| Immigrants | Romania | 66.3 /100 | #155 | Good 11.5% |
| Immigrants | Germany | 65.9 /100 | #156 | Good 11.5% |
| Indians (Asian) | 65.1 /100 | #157 | Good 11.5% |
| Immigrants | Turkey | 64.8 /100 | #158 | Good 11.5% |
| Immigrants | Western Europe | 64.7 /100 | #159 | Good 11.5% |
| Immigrants | Eastern Asia | 64.5 /100 | #160 | Good 11.5% |