Italian vs Immigrants from Spain Male Unemployment
COMPARE
Italian
Immigrants from Spain
Male Unemployment
Male Unemployment Comparison
Italians
Immigrants from Spain
5.1%
MALE UNEMPLOYMENT
93.8/ 100
METRIC RATING
95th/ 347
METRIC RANK
5.1%
MALE UNEMPLOYMENT
93.4/ 100
METRIC RATING
97th/ 347
METRIC RANK
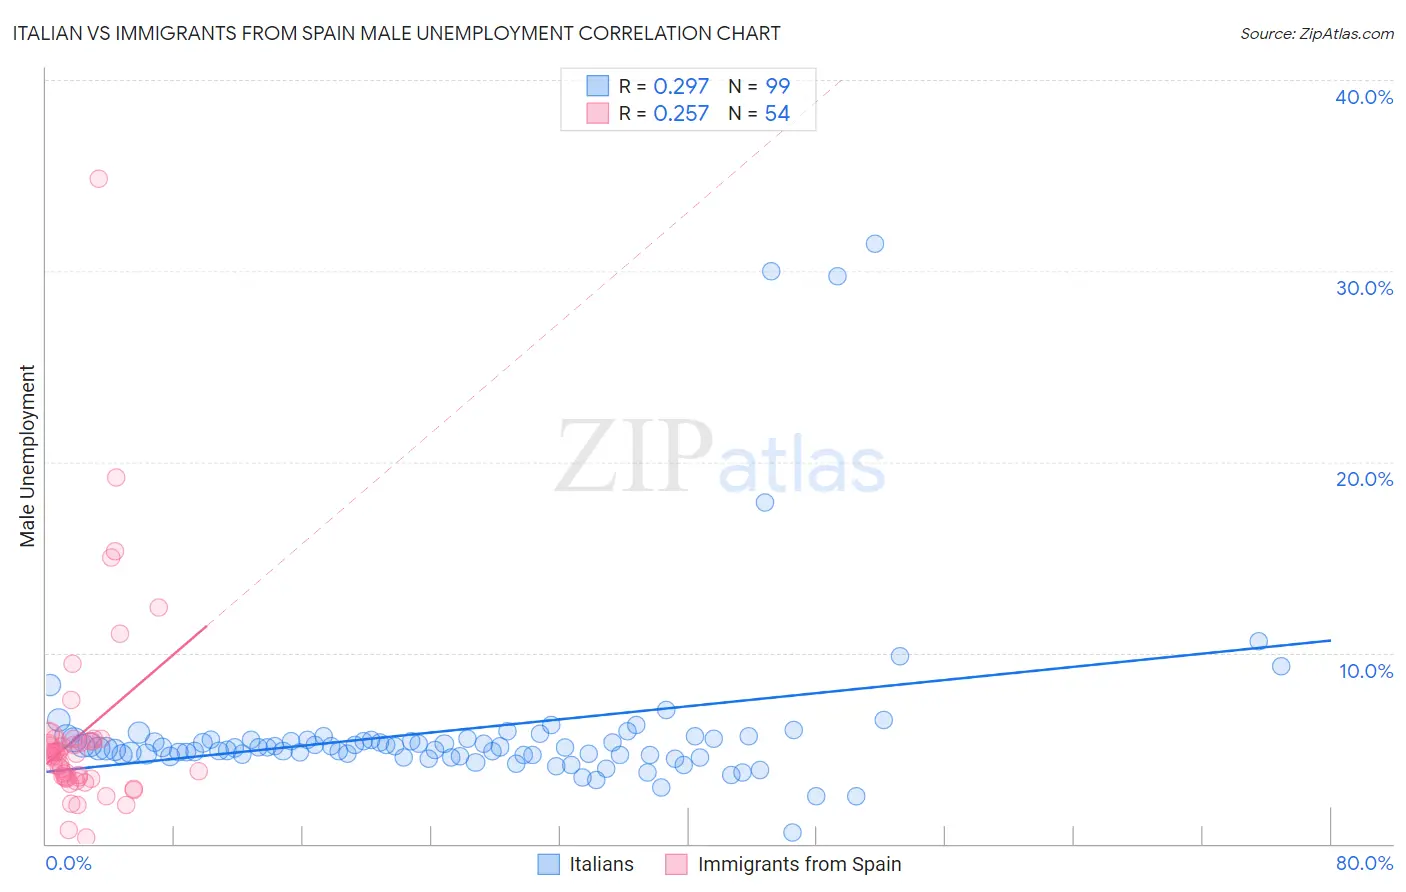
Italian vs Immigrants from Spain Male Unemployment Correlation Chart
The statistical analysis conducted on geographies consisting of 563,762,054 people shows a weak positive correlation between the proportion of Italians and unemployment rate among males in the United States with a correlation coefficient (R) of 0.297 and weighted average of 5.1%. Similarly, the statistical analysis conducted on geographies consisting of 239,356,237 people shows a weak positive correlation between the proportion of Immigrants from Spain and unemployment rate among males in the United States with a correlation coefficient (R) of 0.257 and weighted average of 5.1%, a difference of 0.090%.
Male Unemployment Correlation Summary
| Measurement | Italian | Immigrants from Spain |
| Minimum | 0.60% | 0.30% |
| Maximum | 31.4% | 34.8% |
| Range | 30.8% | 34.5% |
| Mean | 6.0% | 5.7% |
| Median | 5.1% | 4.6% |
| Interquartile 25% (IQ1) | 4.6% | 3.5% |
| Interquartile 75% (IQ3) | 5.5% | 5.4% |
| Interquartile Range (IQR) | 0.82% | 1.9% |
| Standard Deviation (Sample) | 4.7% | 5.3% |
| Standard Deviation (Population) | 4.7% | 5.3% |
Demographics Similar to Italians and Immigrants from Spain by Male Unemployment
In terms of male unemployment, the demographic groups most similar to Italians are Asian (5.1%, a difference of 0.030%), Canadian (5.1%, a difference of 0.080%), Slavic (5.1%, a difference of 0.12%), Immigrants from Serbia (5.1%, a difference of 0.12%), and Immigrants from Kuwait (5.1%, a difference of 0.13%). Similarly, the demographic groups most similar to Immigrants from Spain are Immigrants from Kuwait (5.1%, a difference of 0.040%), Asian (5.1%, a difference of 0.070%), Uruguayan (5.1%, a difference of 0.10%), Russian (5.1%, a difference of 0.12%), and German Russian (5.1%, a difference of 0.16%).
| Demographics | Rating | Rank | Male Unemployment |
| Maltese | 95.5 /100 | #86 | Exceptional 5.1% |
| Immigrants | Romania | 95.4 /100 | #87 | Exceptional 5.1% |
| Immigrants | Sri Lanka | 94.9 /100 | #88 | Exceptional 5.1% |
| Immigrants | Australia | 94.7 /100 | #89 | Exceptional 5.1% |
| Okinawans | 94.7 /100 | #90 | Exceptional 5.1% |
| Immigrants | Turkey | 94.4 /100 | #91 | Exceptional 5.1% |
| Slavs | 94.2 /100 | #92 | Exceptional 5.1% |
| Immigrants | Serbia | 94.2 /100 | #93 | Exceptional 5.1% |
| Canadians | 94.1 /100 | #94 | Exceptional 5.1% |
| Italians | 93.8 /100 | #95 | Exceptional 5.1% |
| Asians | 93.7 /100 | #96 | Exceptional 5.1% |
| Immigrants | Spain | 93.4 /100 | #97 | Exceptional 5.1% |
| Immigrants | Kuwait | 93.3 /100 | #98 | Exceptional 5.1% |
| Uruguayans | 93.0 /100 | #99 | Exceptional 5.1% |
| Russians | 92.9 /100 | #100 | Exceptional 5.1% |
| German Russians | 92.7 /100 | #101 | Exceptional 5.1% |
| Immigrants | France | 92.7 /100 | #102 | Exceptional 5.1% |
| Immigrants | Jordan | 91.9 /100 | #103 | Exceptional 5.1% |
| Immigrants | Chile | 91.8 /100 | #104 | Exceptional 5.1% |
| Immigrants | Czechoslovakia | 91.7 /100 | #105 | Exceptional 5.1% |
| Immigrants | Ethiopia | 91.5 /100 | #106 | Exceptional 5.1% |