Irish vs Immigrants from Spain Male Unemployment
COMPARE
Irish
Immigrants from Spain
Male Unemployment
Male Unemployment Comparison
Irish
Immigrants from Spain
5.0%
MALE UNEMPLOYMENT
98.8/ 100
METRIC RATING
52nd/ 347
METRIC RANK
5.1%
MALE UNEMPLOYMENT
93.4/ 100
METRIC RATING
97th/ 347
METRIC RANK
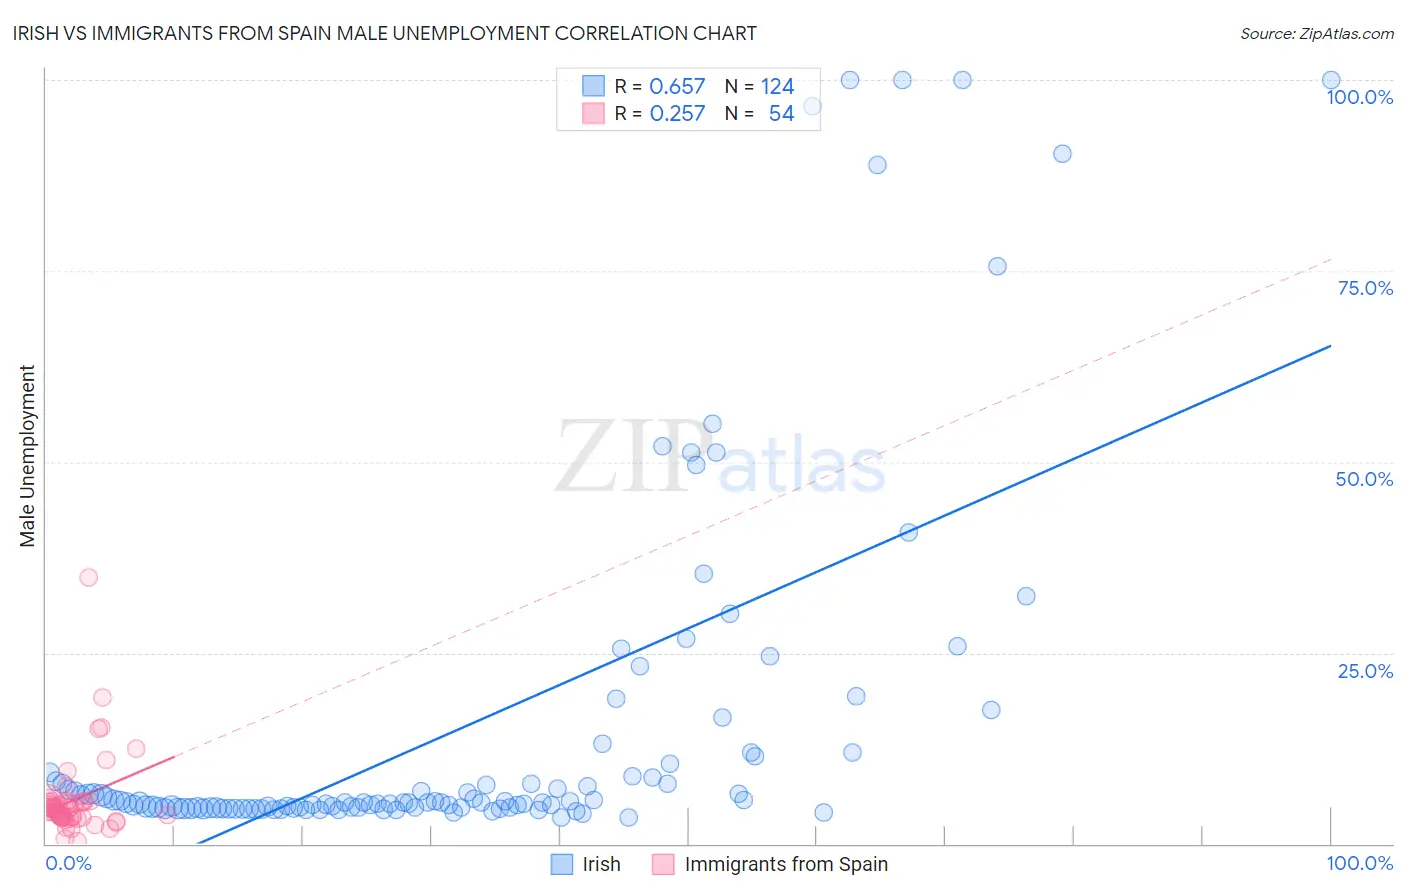
Irish vs Immigrants from Spain Male Unemployment Correlation Chart
The statistical analysis conducted on geographies consisting of 566,974,673 people shows a significant positive correlation between the proportion of Irish and unemployment rate among males in the United States with a correlation coefficient (R) of 0.657 and weighted average of 5.0%. Similarly, the statistical analysis conducted on geographies consisting of 239,356,237 people shows a weak positive correlation between the proportion of Immigrants from Spain and unemployment rate among males in the United States with a correlation coefficient (R) of 0.257 and weighted average of 5.1%, a difference of 2.8%.
Male Unemployment Correlation Summary
| Measurement | Irish | Immigrants from Spain |
| Minimum | 3.4% | 0.30% |
| Maximum | 100.0% | 34.8% |
| Range | 96.6% | 34.5% |
| Mean | 15.4% | 5.7% |
| Median | 5.4% | 4.6% |
| Interquartile 25% (IQ1) | 4.7% | 3.5% |
| Interquartile 75% (IQ3) | 9.9% | 5.4% |
| Interquartile Range (IQR) | 5.2% | 1.9% |
| Standard Deviation (Sample) | 23.5% | 5.3% |
| Standard Deviation (Population) | 23.4% | 5.3% |
Similar Demographics by Male Unemployment
Demographics Similar to Irish by Male Unemployment
In terms of male unemployment, the demographic groups most similar to Irish are Slovene (5.0%, a difference of 0.020%), Polish (4.9%, a difference of 0.060%), Croatian (4.9%, a difference of 0.060%), Jordanian (5.0%, a difference of 0.060%), and Immigrants from Scotland (4.9%, a difference of 0.080%).
| Demographics | Rating | Rank | Male Unemployment |
| Immigrants | Zimbabwe | 99.0 /100 | #45 | Exceptional 4.9% |
| Bhutanese | 98.9 /100 | #46 | Exceptional 4.9% |
| Austrians | 98.9 /100 | #47 | Exceptional 4.9% |
| Immigrants | Scotland | 98.9 /100 | #48 | Exceptional 4.9% |
| Poles | 98.9 /100 | #49 | Exceptional 4.9% |
| Croatians | 98.9 /100 | #50 | Exceptional 4.9% |
| Slovenes | 98.8 /100 | #51 | Exceptional 5.0% |
| Irish | 98.8 /100 | #52 | Exceptional 5.0% |
| Jordanians | 98.8 /100 | #53 | Exceptional 5.0% |
| Yugoslavians | 98.7 /100 | #54 | Exceptional 5.0% |
| Czechoslovakians | 98.7 /100 | #55 | Exceptional 5.0% |
| Immigrants | Bulgaria | 98.7 /100 | #56 | Exceptional 5.0% |
| Turks | 98.5 /100 | #57 | Exceptional 5.0% |
| Lithuanians | 98.5 /100 | #58 | Exceptional 5.0% |
| Immigrants | Netherlands | 98.3 /100 | #59 | Exceptional 5.0% |
Demographics Similar to Immigrants from Spain by Male Unemployment
In terms of male unemployment, the demographic groups most similar to Immigrants from Spain are Immigrants from Kuwait (5.1%, a difference of 0.040%), Asian (5.1%, a difference of 0.070%), Italian (5.1%, a difference of 0.090%), Uruguayan (5.1%, a difference of 0.10%), and Russian (5.1%, a difference of 0.12%).
| Demographics | Rating | Rank | Male Unemployment |
| Okinawans | 94.7 /100 | #90 | Exceptional 5.1% |
| Immigrants | Turkey | 94.4 /100 | #91 | Exceptional 5.1% |
| Slavs | 94.2 /100 | #92 | Exceptional 5.1% |
| Immigrants | Serbia | 94.2 /100 | #93 | Exceptional 5.1% |
| Canadians | 94.1 /100 | #94 | Exceptional 5.1% |
| Italians | 93.8 /100 | #95 | Exceptional 5.1% |
| Asians | 93.7 /100 | #96 | Exceptional 5.1% |
| Immigrants | Spain | 93.4 /100 | #97 | Exceptional 5.1% |
| Immigrants | Kuwait | 93.3 /100 | #98 | Exceptional 5.1% |
| Uruguayans | 93.0 /100 | #99 | Exceptional 5.1% |
| Russians | 92.9 /100 | #100 | Exceptional 5.1% |
| German Russians | 92.7 /100 | #101 | Exceptional 5.1% |
| Immigrants | France | 92.7 /100 | #102 | Exceptional 5.1% |
| Immigrants | Jordan | 91.9 /100 | #103 | Exceptional 5.1% |
| Immigrants | Chile | 91.8 /100 | #104 | Exceptional 5.1% |