Iranian vs Ottawa Unemployment Among Ages 60 to 64 years
COMPARE
Iranian
Ottawa
Unemployment Among Ages 60 to 64 years
Unemployment Among Ages 60 to 64 years Comparison
Iranians
Ottawa
5.0%
UNEMPLOYMENT AMONG AGES 60 TO 64 YEARS
4.2/ 100
METRIC RATING
234th/ 347
METRIC RANK
4.9%
UNEMPLOYMENT AMONG AGES 60 TO 64 YEARS
11.6/ 100
METRIC RATING
220th/ 347
METRIC RANK
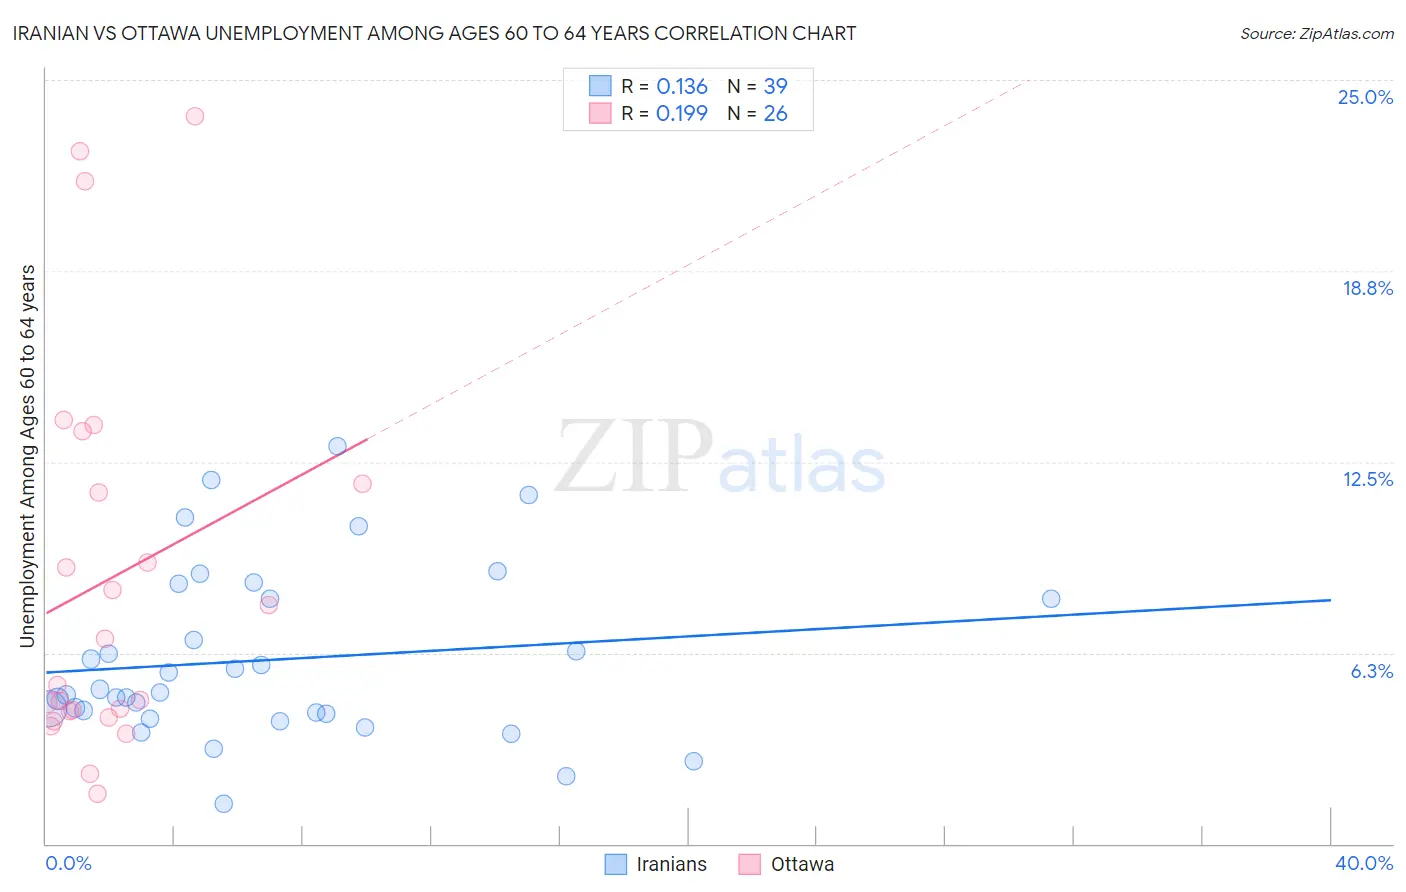
Iranian vs Ottawa Unemployment Among Ages 60 to 64 years Correlation Chart
The statistical analysis conducted on geographies consisting of 294,419,249 people shows a poor positive correlation between the proportion of Iranians and unemployment rate among population between the ages 60 and 64 in the United States with a correlation coefficient (R) of 0.136 and weighted average of 5.0%. Similarly, the statistical analysis conducted on geographies consisting of 47,404,743 people shows a poor positive correlation between the proportion of Ottawa and unemployment rate among population between the ages 60 and 64 in the United States with a correlation coefficient (R) of 0.199 and weighted average of 4.9%, a difference of 0.96%.
Unemployment Among Ages 60 to 64 years Correlation Summary
| Measurement | Iranian | Ottawa |
| Minimum | 1.3% | 1.7% |
| Maximum | 13.0% | 23.8% |
| Range | 11.7% | 22.1% |
| Mean | 6.0% | 8.7% |
| Median | 5.0% | 5.9% |
| Interquartile 25% (IQ1) | 4.2% | 4.3% |
| Interquartile 75% (IQ3) | 8.0% | 11.8% |
| Interquartile Range (IQR) | 3.8% | 7.5% |
| Standard Deviation (Sample) | 2.8% | 6.3% |
| Standard Deviation (Population) | 2.8% | 6.2% |
Demographics Similar to Iranians and Ottawa by Unemployment Among Ages 60 to 64 years
In terms of unemployment among ages 60 to 64 years, the demographic groups most similar to Iranians are Immigrants from Greece (5.0%, a difference of 0.10%), Immigrants from Eastern Asia (5.0%, a difference of 0.12%), Delaware (5.0%, a difference of 0.13%), Immigrants from Sierra Leone (5.0%, a difference of 0.26%), and Tohono O'odham (5.0%, a difference of 0.29%). Similarly, the demographic groups most similar to Ottawa are Immigrants from Brazil (4.9%, a difference of 0.010%), Immigrants from Singapore (4.9%, a difference of 0.040%), Korean (4.9%, a difference of 0.050%), Ugandan (4.9%, a difference of 0.10%), and Brazilian (5.0%, a difference of 0.14%).
| Demographics | Rating | Rank | Unemployment Among Ages 60 to 64 years |
| Koreans | 12.2 /100 | #217 | Poor 4.9% |
| Immigrants | Singapore | 12.0 /100 | #218 | Poor 4.9% |
| Immigrants | Brazil | 11.7 /100 | #219 | Poor 4.9% |
| Ottawa | 11.6 /100 | #220 | Poor 4.9% |
| Ugandans | 10.5 /100 | #221 | Poor 4.9% |
| Brazilians | 10.1 /100 | #222 | Poor 5.0% |
| Crow | 9.7 /100 | #223 | Tragic 5.0% |
| Immigrants | Cameroon | 8.5 /100 | #224 | Tragic 5.0% |
| Immigrants | Ireland | 7.2 /100 | #225 | Tragic 5.0% |
| Immigrants | Chile | 6.8 /100 | #226 | Tragic 5.0% |
| Nigerians | 6.8 /100 | #227 | Tragic 5.0% |
| Immigrants | Belarus | 6.4 /100 | #228 | Tragic 5.0% |
| Africans | 5.9 /100 | #229 | Tragic 5.0% |
| Immigrants | Denmark | 5.8 /100 | #230 | Tragic 5.0% |
| Tohono O'odham | 5.7 /100 | #231 | Tragic 5.0% |
| Immigrants | Eastern Asia | 4.7 /100 | #232 | Tragic 5.0% |
| Immigrants | Greece | 4.6 /100 | #233 | Tragic 5.0% |
| Iranians | 4.2 /100 | #234 | Tragic 5.0% |
| Delaware | 3.6 /100 | #235 | Tragic 5.0% |
| Immigrants | Sierra Leone | 3.1 /100 | #236 | Tragic 5.0% |
| Immigrants | Western Asia | 3.0 /100 | #237 | Tragic 5.0% |