Cape Verdean vs Ottawa Unemployment Among Ages 60 to 64 years
COMPARE
Cape Verdean
Ottawa
Unemployment Among Ages 60 to 64 years
Unemployment Among Ages 60 to 64 years Comparison
Cape Verdeans
Ottawa
4.4%
UNEMPLOYMENT AMONG AGES 60 TO 64 YEARS
100.0/ 100
METRIC RATING
22nd/ 347
METRIC RANK
4.9%
UNEMPLOYMENT AMONG AGES 60 TO 64 YEARS
11.6/ 100
METRIC RATING
220th/ 347
METRIC RANK
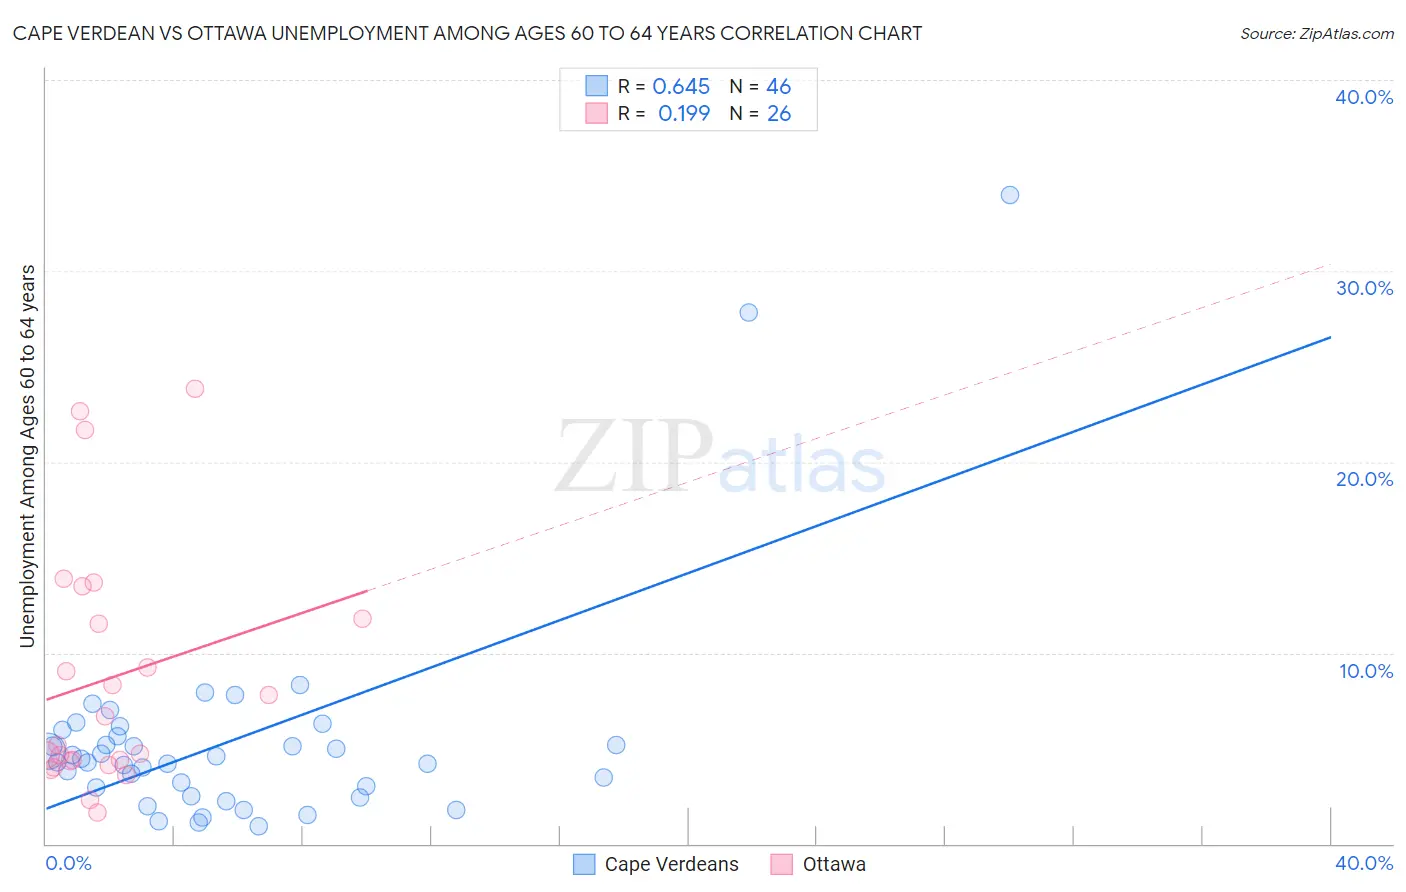
Cape Verdean vs Ottawa Unemployment Among Ages 60 to 64 years Correlation Chart
The statistical analysis conducted on geographies consisting of 104,523,117 people shows a significant positive correlation between the proportion of Cape Verdeans and unemployment rate among population between the ages 60 and 64 in the United States with a correlation coefficient (R) of 0.645 and weighted average of 4.4%. Similarly, the statistical analysis conducted on geographies consisting of 47,404,743 people shows a poor positive correlation between the proportion of Ottawa and unemployment rate among population between the ages 60 and 64 in the United States with a correlation coefficient (R) of 0.199 and weighted average of 4.9%, a difference of 12.4%.
Unemployment Among Ages 60 to 64 years Correlation Summary
| Measurement | Cape Verdean | Ottawa |
| Minimum | 0.90% | 1.7% |
| Maximum | 34.0% | 23.8% |
| Range | 33.1% | 22.1% |
| Mean | 5.4% | 8.7% |
| Median | 4.4% | 5.9% |
| Interquartile 25% (IQ1) | 2.9% | 4.3% |
| Interquartile 75% (IQ3) | 5.6% | 11.8% |
| Interquartile Range (IQR) | 2.7% | 7.5% |
| Standard Deviation (Sample) | 5.9% | 6.3% |
| Standard Deviation (Population) | 5.8% | 6.2% |
Similar Demographics by Unemployment Among Ages 60 to 64 years
Demographics Similar to Cape Verdeans by Unemployment Among Ages 60 to 64 years
In terms of unemployment among ages 60 to 64 years, the demographic groups most similar to Cape Verdeans are Afghan (4.4%, a difference of 0.080%), Immigrants from Cabo Verde (4.4%, a difference of 0.080%), Immigrants from Zaire (4.4%, a difference of 0.20%), Tsimshian (4.4%, a difference of 0.23%), and Slovene (4.4%, a difference of 0.33%).
| Demographics | Rating | Rank | Unemployment Among Ages 60 to 64 years |
| Sudanese | 100.0 /100 | #15 | Exceptional 4.3% |
| Danes | 100.0 /100 | #16 | Exceptional 4.4% |
| Immigrants | Afghanistan | 100.0 /100 | #17 | Exceptional 4.4% |
| Slovenes | 100.0 /100 | #18 | Exceptional 4.4% |
| Tsimshian | 100.0 /100 | #19 | Exceptional 4.4% |
| Afghans | 100.0 /100 | #20 | Exceptional 4.4% |
| Immigrants | Cabo Verde | 100.0 /100 | #21 | Exceptional 4.4% |
| Cape Verdeans | 100.0 /100 | #22 | Exceptional 4.4% |
| Immigrants | Zaire | 100.0 /100 | #23 | Exceptional 4.4% |
| Immigrants | Burma/Myanmar | 100.0 /100 | #24 | Exceptional 4.4% |
| Yugoslavians | 100.0 /100 | #25 | Exceptional 4.4% |
| Czechs | 100.0 /100 | #26 | Exceptional 4.4% |
| Immigrants | Iraq | 100.0 /100 | #27 | Exceptional 4.5% |
| Immigrants | Nepal | 100.0 /100 | #28 | Exceptional 4.5% |
| Cubans | 100.0 /100 | #29 | Exceptional 4.5% |
Demographics Similar to Ottawa by Unemployment Among Ages 60 to 64 years
In terms of unemployment among ages 60 to 64 years, the demographic groups most similar to Ottawa are Immigrants from Brazil (4.9%, a difference of 0.010%), Immigrants from Singapore (4.9%, a difference of 0.040%), Korean (4.9%, a difference of 0.050%), Cajun (4.9%, a difference of 0.060%), and Ugandan (4.9%, a difference of 0.10%).
| Demographics | Rating | Rank | Unemployment Among Ages 60 to 64 years |
| Eastern Europeans | 14.3 /100 | #213 | Poor 4.9% |
| Immigrants | Russia | 13.7 /100 | #214 | Poor 4.9% |
| Immigrants | South Eastern Asia | 13.1 /100 | #215 | Poor 4.9% |
| Cajuns | 12.3 /100 | #216 | Poor 4.9% |
| Koreans | 12.2 /100 | #217 | Poor 4.9% |
| Immigrants | Singapore | 12.0 /100 | #218 | Poor 4.9% |
| Immigrants | Brazil | 11.7 /100 | #219 | Poor 4.9% |
| Ottawa | 11.6 /100 | #220 | Poor 4.9% |
| Ugandans | 10.5 /100 | #221 | Poor 4.9% |
| Brazilians | 10.1 /100 | #222 | Poor 5.0% |
| Crow | 9.7 /100 | #223 | Tragic 5.0% |
| Immigrants | Cameroon | 8.5 /100 | #224 | Tragic 5.0% |
| Immigrants | Ireland | 7.2 /100 | #225 | Tragic 5.0% |
| Immigrants | Chile | 6.8 /100 | #226 | Tragic 5.0% |
| Nigerians | 6.8 /100 | #227 | Tragic 5.0% |